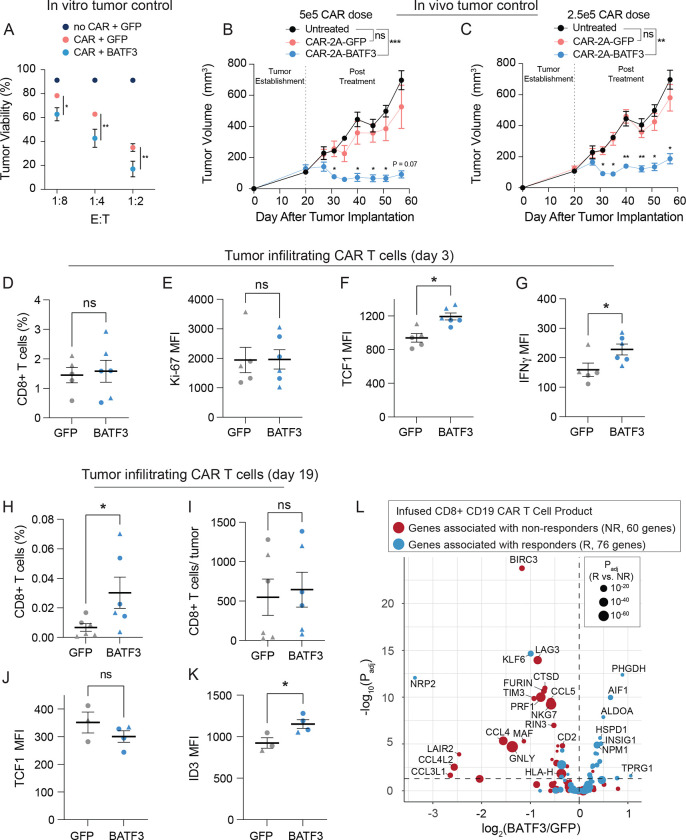
Figure 5. BATF3 OE enhances tumor control in vivo and programs a transcriptional signature associated with clinical response to ACT.
(A) Tumor viability after 24 hours of co-culture with GFP CARnull, GFP CAR+, and BATF3 OE CAR+ CD8 T cells at indicated effector to target (E:T) cell ratios (n = 3 individual donors, error bars represent SEM). A two-way ANOVA with Dunnett’s post hoc test was used to compare tumor viability between GFP+CAR+ and BATF3+CAR+ T cells at each E:T ratio.
Tumor volume over time for untreated mice and mice treated with (B) 5 × 10⁵ or (C) 2.5 × 10⁵ CAR T cells with or without BATF3 overexpression (n = 1 donor, 4–5 mice per treatment, error bars represent SEM). A two-way ANOVA was used to compare the tumor volumes at each time point across treatments. Tumor volumes were not statistically different between untreated and control CAR groups at any time point. Tumor volumes were significantly different between untreated and BATF3 OE CAR groups from day 31 onward. The asterisks above the blue lines indicate significant differences in tumor volumes between mice treated with control and BATF3 OE CAR T cells at each time point.
(D) Average percentage of CD8+ T cells within each resected, dissociated tumor on day 3 post-treatment (n = 2 donors, 2–3 mice per donor, error bars represent SEM). A Mann-Whitney test was used to compare the percentage of CD8+ cells between groups.
(E-G) Ki-67, TCF1, and IFNγ MFI of tumor infiltrating CAR T cells on day 3 across groups (n = 2 donors, 2–3 mice per donor, error bars represent SEM). Unpaired t tests were used to compare MFI between groups.
(H) Average percentage and (I) total number of CD8+ T cells within each resected, dissociated tumor on day 19 post-treatment across groups. A Mann-Whitney test was used to compare the percentage and total number of CD8+ cells between the two groups.
(J-K) TCF1 and ID3 MFI of tumor infiltrating CAR T cells on day 19 across groups (n = 2 donors, 1–3 mice per donor, error bars represent SEM). Unpaired t tests were used to compare MFI between groups.
(L) Volcano plot of significance (Padj) versus fold change between BATF3 OE and control CD8+ T cells for a subset of 144 genes that were negatively (red data points) or positively (blue data points) associated with clinical outcome to CD19 CAR T cell treatment. The size of each data point corresponds to the strength of association between gene expression and clinical response.

