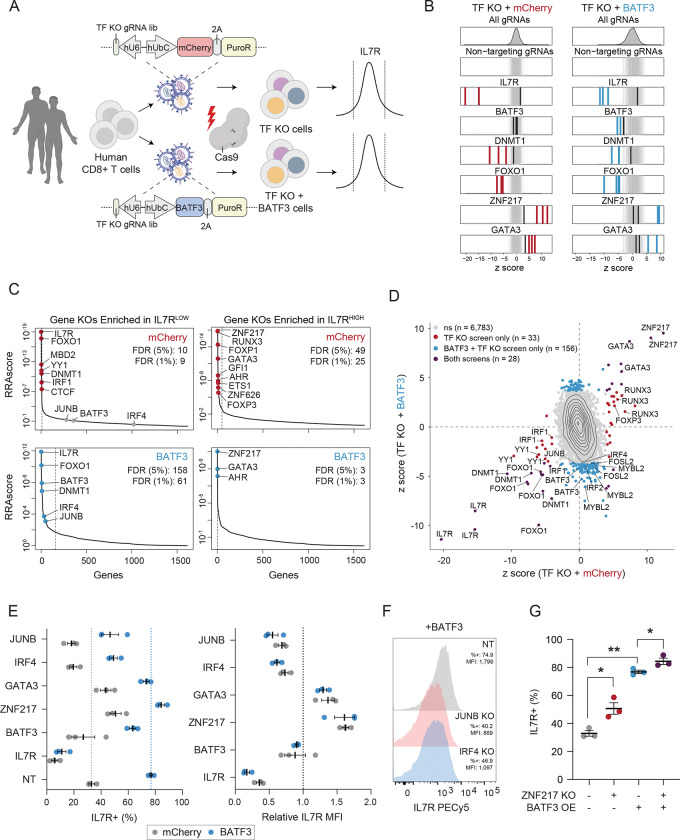
Figure 6. CRISPRko screens reveal co-factors of BATF3 and novel targets for cancer immunotherapy.
(A) Schematic of CRISPRko screens.
(B) z scores of gRNAs for selected genes in mCherry (left) and BATF3 (right) screens. Enriched gRNAs (Padj < 0.01) are labeled in red or blue for each screen. Non-targeting gRNAs are labeled in gray.
(C) Each gene target in the mCherry (top) and BATF3 (bottom) screens ranked based on the MAGeCK robust ranking aggregation (RRA) score in both IL7RLOW (left) and IL7RHIGH (right) populations. Red and blue data points represent enriched genes in each screen. Dashed lines indicate an FDR < 0.05 cutoff.
(D) Scatter plot of z scores for each gRNA in CRISPR-ko screens with mCherry and BATF3 with enriched gRNAs (Padj < 0.01) colored blue, red, or dark purple.
(E) Average percentage IL7R+ (left) and relative IL7R MFI (right) in CD8+ T cells with mCherry or BATF3 across gRNAs. Relative IL7R MFI was calculated by dividing the IL7R MFI of each targeting gRNA by the IL7R MFI of the non-targeting gRNA for each donor within the treatment group (n = 3 donors, error bars represent SEM).
(F) Representative histograms of IL7R expression in CD8+ T cells with BATF3 overexpression in combination with JUNB or IRF4 gene knockouts.
(G) Individual and combined effects of ZNF217 knockout and BATF3 overexpression on the percentage of IL7R+ cells (n =3 donors, error bars represent SEM). A one-way, paired ANOVA test with Tukey’s post hoc test was used to compare the mean percentage of IL7R+ cells between groups.

