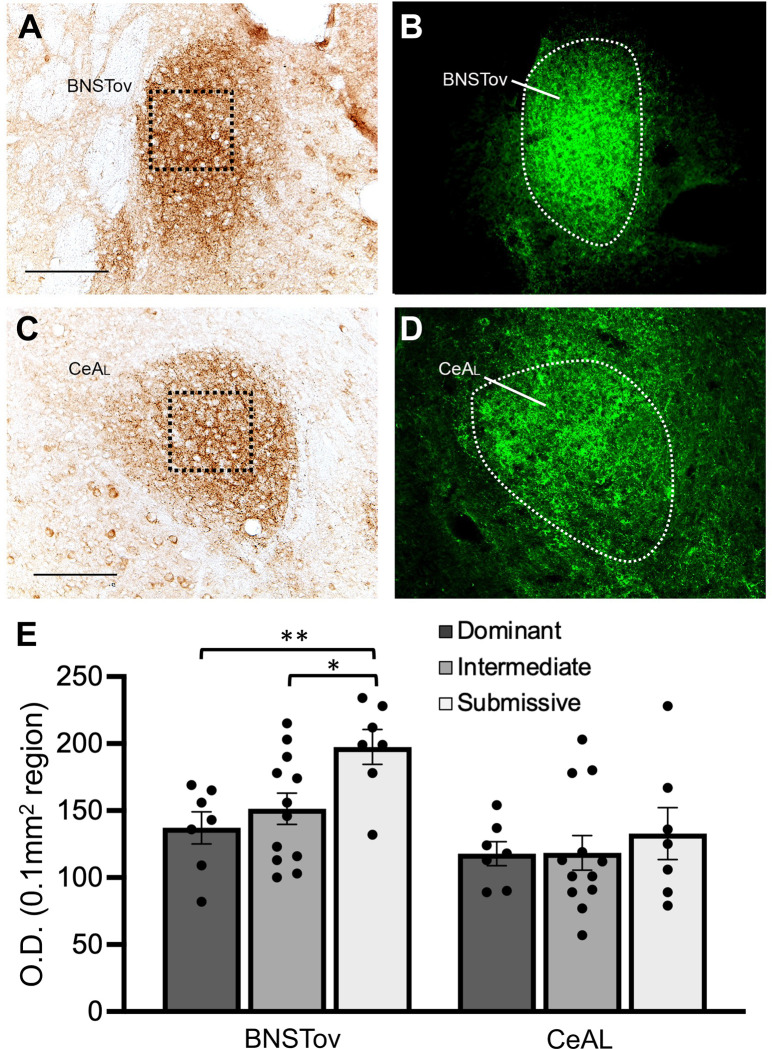
Figure 2.
Representative coronal sections through the BNST (A, B) and CeA (C, D) showing PACAP expression; fluorescent images in B and D illustrate the approximate boundaries of the BNSTov and CeAL respectively. Optical density (O.D.) measurements of PACAP expression in 0.1 mm2 regions (boxes in A and C) in the BSNTov and CeAL were analyzed from brains of animals identified as Dominant, Intermediate or Submissive from scoring of social dominance interactions at 12 weeks of age. (E) Average O.D. values of PACAP expression in the BNSTov and CeL for each group. Animals in the Submissive group showed significantly higher levels PACAP expression in the BNSTov compared to the other two groups; PACAP expression was not significantly different in the CeAL between groups. Bar graph data are shown as mean±s.e.m. **P<0.005 , *P<0.05. Scale bars = 100 μm.

