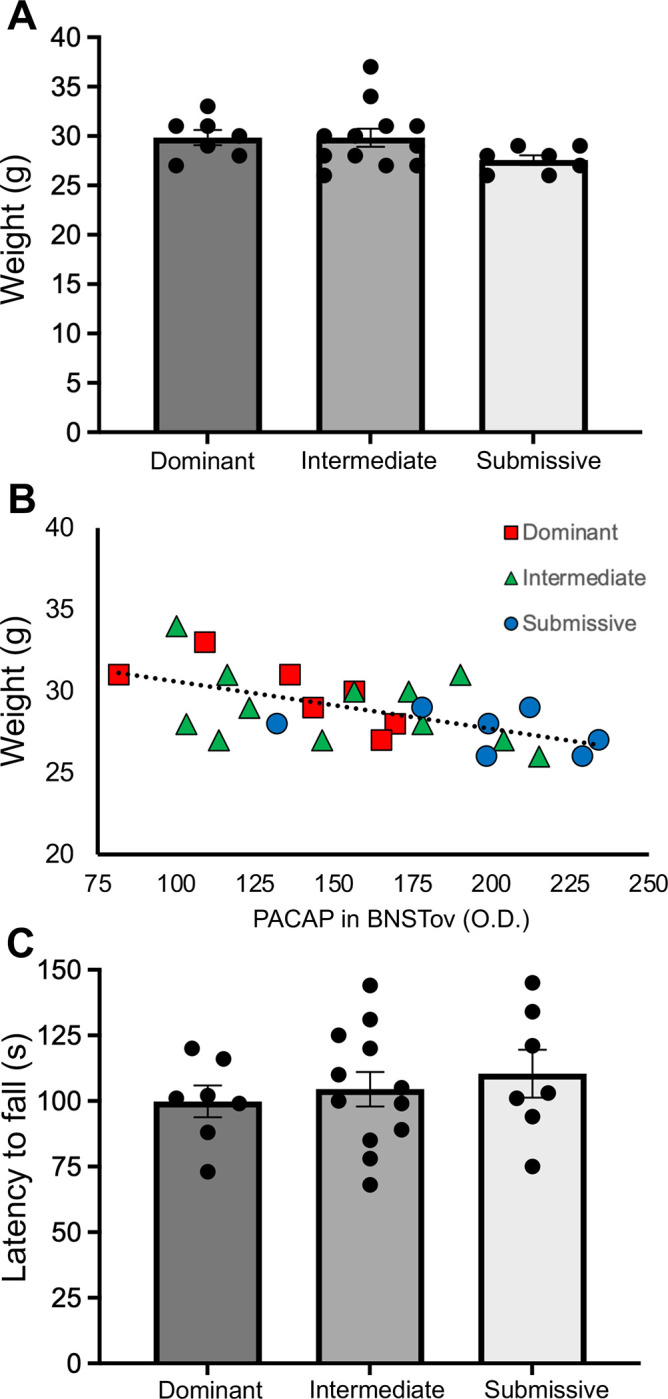
Figure 3.

(A) Average body weight data from animals in the different social dominance groups at 12 weeks of age. (B). Relationship between body weight data and BNSTov PACAP expression (O.D.; optical density value from 0.1 mm2 region) for animals in the different social dominance groups; there was an overall trend for animals with lower body weight to have higher BNSTov PACAP expression levels (r2=0.34), but this correlation was not significant. (C) Average rotorod data from these same animals in the different social dominance groups. Bar graph data are shown as mean±s.e.m.
