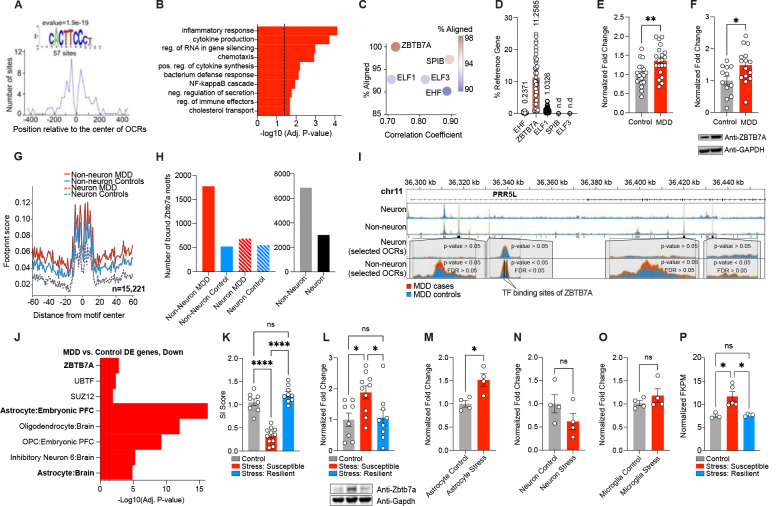
Fig. 2. Identification of ZBTB7A as a key transcription factor regulating MDD-specific OCRs.
(A) Distribution of the discovered motif that is significantly enriched (e-value = 1.9e-19) in MDD-specific OCRs. (B) GO BP terms from MEME-GoMo, based on gene targets of regulatory regions containing the discovered motif. Top 10 most significant terms are shown (BH-adjusted p-value < 0.05). Dashed line indicates p = 0.05 significance. (C) Correlation coefficients for TF candidate recognition motifs against discovered motif (x-axis), and percent alignment between TF candidate recognition motifs with discovered motif (y-axis and color key) (D) Percent expression of TF candidate genes (CT value) over reference gene (HPRT1). “n.d.” indicates not detected (E) Normalized fold change of ZBTB7A transcripts in bulk OFC postmortem human tissues from MDD (n = 20) vs. control (n = 19) samples. Student’s two-tailed t-test [t37 = 3.215, **p = 0.0027] (F) Normalized fold change of ZBTB7A protein in bulk OFC postmortem human tissues from MDD (n = 15) vs. control (n = 12) samples. Student’s two-tailed t-test [t25 = 2.441, *p = 0.0221] (G) Aggregated footprint scores across ZBTB7A transcription factor binding sites that are bound in either MDD or control samples of neuronal or non-neuronal cells. Note that the effect of Tn5 transposase bias is not fully corrected, resulting into unsmoothed signal. (H) Bar graphs for number of bound ZBTB7A TFBS detected exclusively in MDD case or control samples from neuronal and non-neuronal cells (left) and exclusively in non-neuronal and neuronal populations (mixed MDD/control (right). (I) Representative pile-up traces of cell specific ATAC-seq signal overlapping PRR5L gene. Four OCRs, all being dysregulated between MDD cases and controls (p-value < 0.05) in non-neuronal cells, are highlighted. The most significantly dysregulated OCR (FDR<0.05) overlaps two transcription factor binding sites of ZBTB7A. (J) GO analysis with CellMarker Augmented Database25 and CHEA ENCODE Consensus database108 for genes in the set of downregulated DE genes from human MDD RNA-seq. (K) Social interaction ratio score for control (n = 8) vs. chronic stress: susceptible (n = 11) vs. chronic stress: resilient mouse (n = 9) groups. 1-way ANOVA [F2,25 = 66.99], followed by Tukey’s MC test: control vs. stress susceptible ****p=<.0001, stress susceptible vs. stress resilient ****p=<.0001, control vs. stress resilient ns, p = .151. (L) Normalized fold change protein expression of Zbtb7a in mouse OFC bulk tissues collected from control vs. chronic stress: susceptible vs. chronic stress: resilient mouse groups. 1-way ANOVA [F2,24 = 4.883], followed by Tukey’s MC test: control vs. stress susceptible *p = 0.03, stress susceptible vs. stress resilient *p = 0.039, control vs. stress resilient ns, p = 0.979. (M) Normalized fold change Zbtb7a mRNA expression in MACs-isolated astrocytes from chronically stressed OFC mouse tissues vs. control (n = 4/group). Two-tailed Student’s t-test [t6 = 3.458]. *p = 0.013. (N) Normalized fold change Zbtb7a mRNA expression in MACs-isolated neurons from chronically stressed OFC mouse tissues vs. control (n = 4/group). Two-tailed Student’s t-test [t6 = 1.454]. ns, p = 0.196. (O) Normalized fold change Zbtb7a mRNA expression in negative cell fraction post MACs-isolation of astrocytes and neurons, which is enriched for microglia, from chronically stressed OFC mouse tissues vs. control (n = 4/group). Two-tailed Student’s t-test [t6 = 1.053]. ns, p = 0.332. (P) FKPM values for Zbtb7a in astrocyte specific CSDS TRAP-seq data set [GSE139684], with n = 3 control, n = 5 stress: susceptible, n = 4 stress-resilient. 1-way ANOVA [F2,9 = 10.01], followed by Tukey’s MC test: control vs. stress susceptible *p = 0.012, stress susceptible vs. stress resilient *p = 0.01, control vs. stress resilient ns, p = 0.989. All data graphed as means ± SEM.

