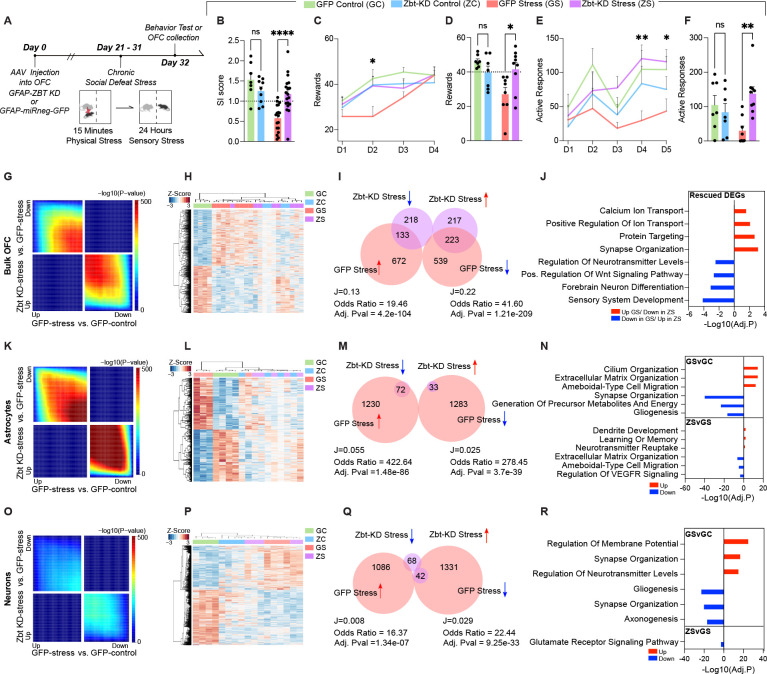
Fig. 3. Zbtb7a in rodent OFC astrocytes is necessary to promote chronic stress-induced alterations in behavior and gene expression.
(A) Schematic of experimental timeline with CSDS paradigm performed after rAAV6 injection into OFC, followed by behavioral test and tissue collection for molecular analyses. (B) Social interaction scores. 2-way ANOVA main effect of interaction [F1,49 = 13.97], ***p = 0.0005. Sidak’s MC test, GFP control vs. GFP stress ****p< 0.0001. GFP Stress vs. Zbt-KD stress **** p<.0001. Zbt-KD control vs. Zbt-KD stress ns, p=.8663. GFP control vs. Zbt-KD control ns, p = 0.2958. (C) Pavlovian cue-reward association task. “D” = Day of task. Mixed Effects analysis, main effect of Test Day x Stress [F3,83 = 3.460] *p = 0.0200. (D) Individual values for Day two of task shown in (C). 2-way ANOVA main effect of Interaction [F1,27 = 8.500] p = 0.0071. Sidak’s MC test GFP control vs. GFP stress **p = 0.0019. GFP stress vs. Zbt-KD stress *p = 0.0119. Zbt-KD control vs. Zbt-KD stress ns, p=.9208. GFP control vs. Zbt-KD control, ns, p = 0.4086. (E) Effort-based operant reward learning task on FR1 schedule, “D” = Day of task. Mixed Effects analysis main effect of Virus x Stress [F1,27 = 5.835] *p = 0.0228. (F) Individual values for Day four of task shown in (E). 2-way ANOVA main effect of Interaction [F1,27 = 8.531] *p = 0.0070. Sidak’s MC test GFP control vs. GFP stress, *p = 0.0490. GFP stress vs. Zbt-KD stress **p = 0.0023. Zbt-KD control vs. Zbt-KD stress ns, p=.1759. GFP control vs. Zbt-KD control ns, p = 0.7740. (G) RRHO comparing gene expression for the indicated comparisons in bulk OFC tissue. Each pixel represents the overlap between differential transcriptomes, with the significance of overlap of a hypergeometric test color-coded. (H) Clustering of groups at 1,583 DE genes (FDR < 0.1) between GFP stress and GFP control in bulk OFC. (I) Scaled Venn-diagram and odds ratio test of the overlap between differentially expressed (DE) genes in bulk OFC tissues comparing Zbt-KD stress vs. GFP stress, with GFP stress vs. GFP control. “J” indicates the Jaccard index. (J) GO analysis for rescued genes in Zbt-KD stress vs. GFP-stress. (K) RRHO comparing gene expression for the indicated comparisons in MACS-isolated astrocytes. Each pixel represents the overlap between differential transcriptomes, with the significance of overlap of a hypergeometric test color-coded. (L) Clustering of groups at 2,673 DE genes (FDR < 0.1) between GFP stress and GFP control in MACS-isolated astrocytes. (M) Scaled Venn-diagram and odds ratio test of the overlap between DE genes in MACS-isolated astrocytes comparing Zbt-KD stress vs. GFP stress, with GFP stress vs. GFP control. “J” indicates the Jaccard index. (N) GO analysis for gene DEGs in GFP-stress vs. GFP control and Zbt-KD stress vs. GFP-stress, separated by up/down regulation. (O) RRHO comparing gene expression for the indicated comparisons in MACS-isolated neurons. Each pixel represents the overlap between differential transcriptomes, with the significance of overlap of a hypergeometric test color-coded. (P) Clustering of groups at 2,540 DE genes (FDR < 0.1) between GFP stress and GFP control in MACS-isolated neurons. (Q) Scaled Venn-diagram and odds ratio test of the overlap between DE genes in MACS-isolated neurons comparing Zbt-KD stress vs. GFP stress, with GFP stress vs. GFP control. “J” indicates the Jaccard index. (R) GO analysis for gene DEGs in GFP-stress vs. GFP control and Zbt-KD stress vs. GFP-stress, separated by up/down regulation. All data graphed as means ± SEM.

