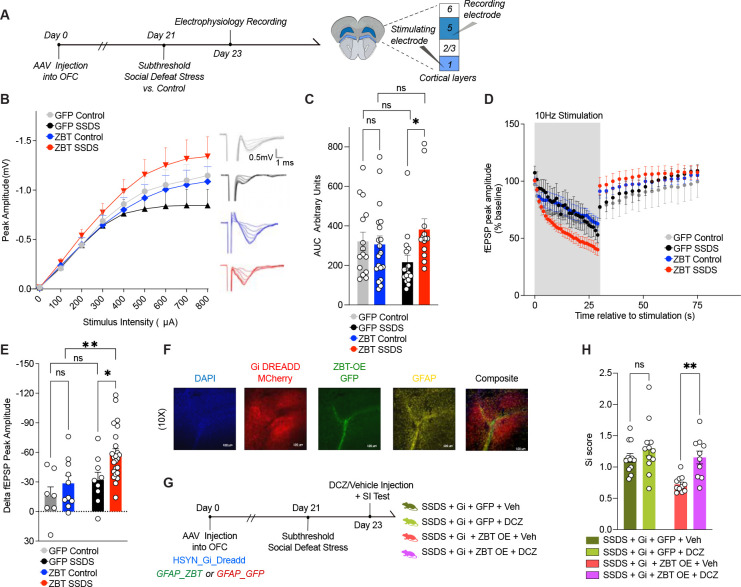
Fig. 5. ZBTB7A in mouse OFC astrocytes induces cell non-autonomous neuronal hyperexcitability to mediate stress susceptibility.
(A) Schematic of experimental timeline with subthreshold stress paradigm performed after AAV6 injection into OFC, followed by slice electrophysiology recordings. (B) Input-output (I-O) curve constructed by recording fEPSPs in response to stimuli ranging from 100–800 μA. 3-way ANOVA, main effect of Stimulus Intensity x Virus x Stress [F8,480 = 2.626] **p = 0.0080. (C) Individual values for (I-O) curve, area under curve (A.U.C). 2-way ANOVA main effect of Interaction [F1,59 = 4.062], *p = 0.0484. Sidak’s MC test, GFP control vs. GFP stress ns, p=0.1923. GFP Stress vs. ZBT-OE stress *p = 0.0295. ZBT-OE control vs. ZBT-OE stress n.s., p = 0.4230. GFP control vs. ZBT-OE control n.s., p= 0.9597. (D) Rundown stimulation from a single 30-s train delivered at 10 Hz. The percentage change in fEPSP amplitude from baseline was calculated during and post-10Hz stimulation. 3-way ANOVA, main effect of Stimulus x Virus [F29,1334 = 3.376] ***p < 0.0001, main effect of stress x virus [F1,46 = 4.356] *p = 0.0425. (E) Individual values for delta fEPSP amplitude (% baseline) between end of 10Hz stimulation and 1s after end of stimulation train. 2-way ANOVA main effect of virus [F1,46 = 6.115], p = 0.0172, main effect of stress [F1,46 = 8.454], **p = 0.0056. Sidak’s MC test, GFP control vs. GFP stress ns, p=0.5172. GFP Stress vs. ZBT-OE stress *p = 0.0207. ZBT-OE control vs. ZBT-OE stress **p = 0.0059. GFP control vs. ZBT-OE control n.s., p= 0.5172. (F) IHC validation of hsyn-hM4D(Gi)-mCherry (in red) and GFAP-ZBT OE (in green) localized in astrocytes (GFAP, in yellow) and DAPI (in blue). Images taken at 10x magnification. (G) Experimental scheme of chemogenetics experiment, in which SSDS is performed on a cohort of mice expressing hM4D(Gi)-mCherry (+/−) ZBT OE, (+/−) DCZ. (H) Social interaction. 2-way ANOVA main effect of Virus [F1,41 = 10.11], **p = 0.0028, main effect of agonist [F1,41 = 10.65], **p = 0.0022. Sidak’s MC test, Gi + GFP stress + vehicle vs. Gi + GFP stress + DCZ ns, p=0.3880. Gi + ZBT-OE stress + vehicle vs. Gi + ZBT-OE stress + DCZ **p = 0.0040. All data graphed as means ± SEM.

