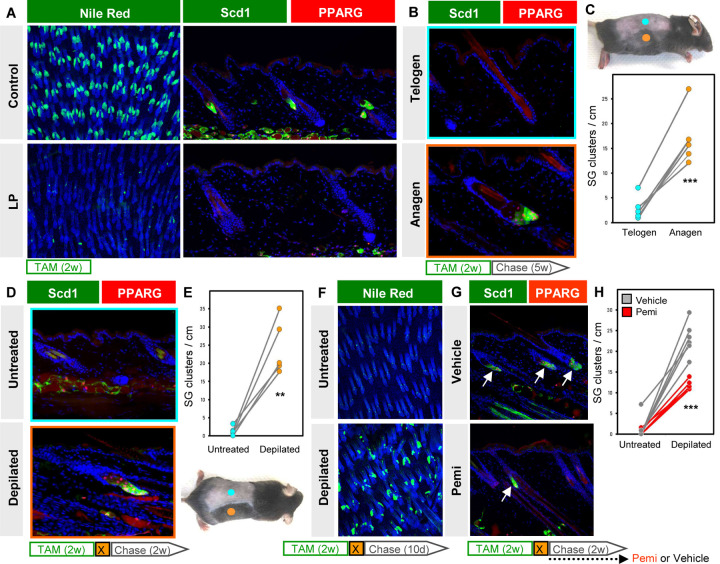
Figure 7. SG regeneration is modulated by hair cycling and FGFR signaling.
A. Left, Nile Red (green) staining of skin whole-mounts from control (top) or LP (bottom) mice treated with TAM-chow for 2 continuous weeks (no chase). Right, confirmation of SG loss by staining for Scd1 (green) and PPARγ (red). B. Scd1/PPARγ staining in telogen (top) or anagen (bottom) skin from the same animal, following 2 weeks of TAM-chow and 5 weeks’ chase. C. Top, example of LP mouse treated with TAM-chow for 2 weeks, followed by 5 weeks’ chase. Sites of natural anagen (orange) or telogen (blue) are denoted. Bottom, SG quantitation for (B). Paired samples are connected by lines. D. Identification of regenerated SGs by Scd1/PPARγ staining in mice treated with TAM-chow for 2 continuous weeks, then depilated (X) and chased for 2 additional weeks. E. Bottom, example of LP mouse used in (D). Sites of depilation (orange) or no treatment (blue) are denoted. Top, quantitation of SG abundance for (D). Paired samples are connected by lines. F. Nile Red (green) staining of whole-mounts from untreated (top) or depilated (bottom) LP skin, where mice were treated with TAM-chow for 2 weeks, depilated and chased for 10 days. G. Identification of regenerated SGs by Scd1/PPARγ staining (arrows), with similar treatment protocol as in (D), but with additional daily treatment with FGFR inhibitor (pemi) or vehicle during the 2 week chase period. H. Quantitation for (G), in LP mice treated with vehicle (grey) or pemi (red). Samples from the same mouse are connected by lines. w, weeks. d, days. **, p < 0.01. ***, p < 0.001. Paired t-test for (C) and (E); unpaired t-test comparing only depilated samples for (H).

