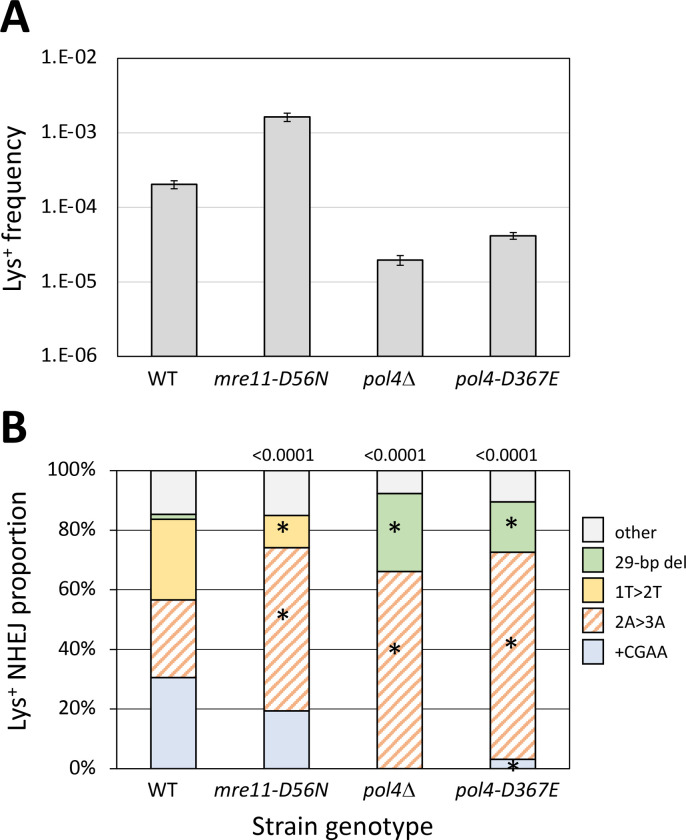
Figure 2.
Frequencies and distributions of Lys+ revertants in strains with altered core NHEJ proteins. (A) Mean frequencies of Lys+ colonies; error bars are 95% confidence intervals for the mean. (B) Distributions of the five major NHEJ types among revertants. Overall distributions were compared to WT using a global 2 × 5 contingency chi square test (p values are above each spectrum) and if p<0.05, then individual mutation types were compared using the Bonferroni correction to determine significance (p<0.05/5); asterisks indicate a significant proportional class increase/decrease.

