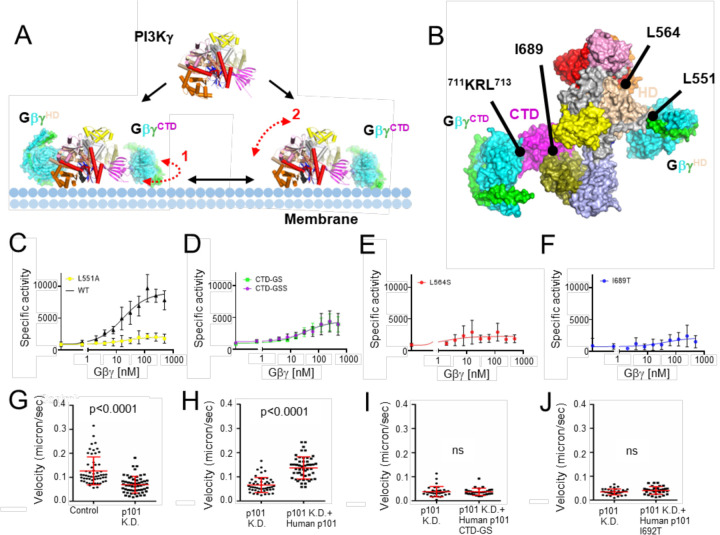
Figure 5. Functional characterization of Gβγ-mediated PI3Kγ activation.
(A) PI3Kγ membrane recruitment via two Gβγ subunits, GβγHD and GβγCTD. Dashed red line 1 indicates the conformational flexibility of the CTD domain of PI3Kγ upon GβγCTD binding that would allow it to move along the plane of the membrane, as suggested by the State 1 and 2 structures we determined. Dashed red line 2 represents the fact that the p110γ subunit is still not fully engaged with the membrane even when tethered to the membrane (in this example by GβγCTD), as suggested previously13. (B) Surface representation of the PI3Kγ·ADP–GβγHD–GβγCTD State 2 structure. The sites targeted by site-directed mutagenesis represent those for Gβγ binding (p110γ-Leu551 and p101-711KRL713) and regulation (p110γ-Leu564 and p101-Ile689). (C-F) Dose response curves of PI3Kγ variants (WT, black triangles; p110γ–L551Ap101, yellow circles; p110γp101-CTD-GS and p110γp101-CTD-GSS, green and purple circles; p110γ–L64Sp101, red circles; p110γp101-I689T, blue circles. Specific activity is nmol ADP·μmol enzyme−1·min−1. (G-J) Neutrophil migration imaging and tracking in a zebrafish embryo 3 days post-fertilization. (G) Quantification of neutrophil tracks under control (PBS) or p101 knock down (MO) background. Representative images are shown in Extended Data Fig 11A–B. (H-J) Quantification of neutrophil tracks under p101 knockdown (MO) background of neutrophils without or with expressing human WT p101 (H), mutant human p101-CTD-GS (I), or mutant human p101-I692T (J). Representative images are shown in Extended Data Fig 11C–E. In (G-J), three independent experiments with n>20 are compiled. p values represent overall effects using the Gehan-Breslow-Wilcoxon test.

