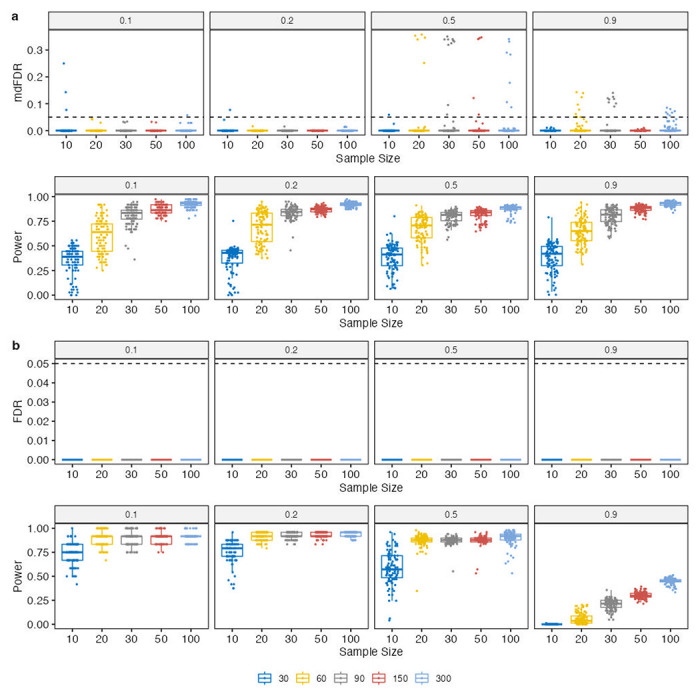
Figure 2.

Comparisons of FDR (mdFDR) and power in identifying DA taxa in (a) multiple pairwise comparisons, and (b) pattern analysis. Synthetic data were generated based on the QMP data20. The X-axis shows the sample size per group, and the Y-axis shows the FDR (mdFDR) or power. The proportion of true DA taxa is indicated in the panel title. The box plot shows the distribution of the corresponding measure (FDR or power) across 100 simulation runs for each setting. Each box represents the interquartile range (IQR) of the data, with the horizontal line in the box representing the median. The whiskers extend to the furthest data point which is within 1.5 times the IQR. Any data points beyond this range are shown as individual points. Additionally, the data points are jittered to avoid overlap and provide a better visualization of the data. The results demonstrate that ANCOM-BC2 controlled FDR (mdFDR) while maintaining adequate power.
