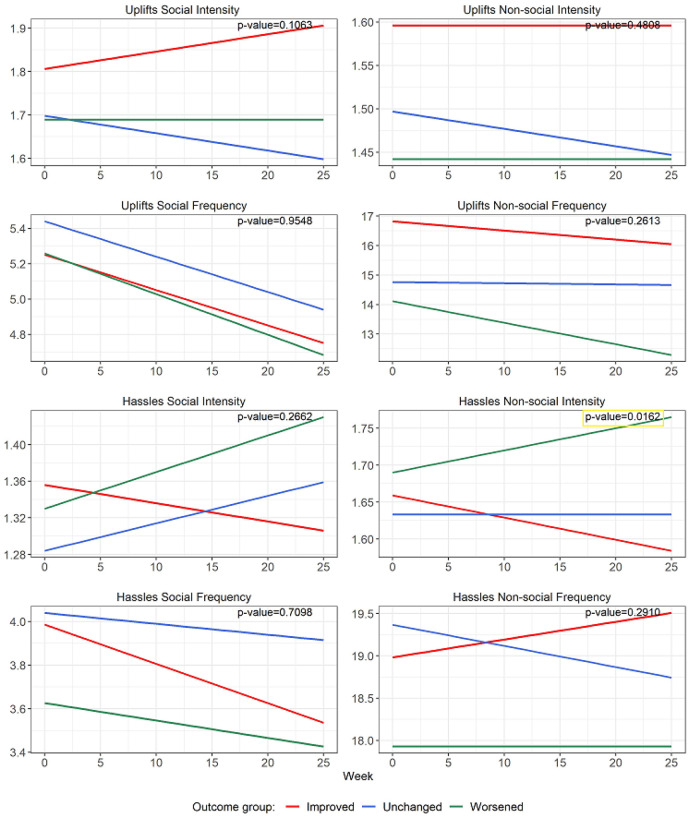
Figure 1.
Linear regression lines of hassles and uplifts over 26 weeks based on linear mixed effect models. P-values indicate if there is a significant different among the three groups. This was found only for Hassles Non-social Intensity (right side, third down). The Uplifts Social Frequency graph (left side, second down) shows a significant downtrend in all three groups (p< .04).

