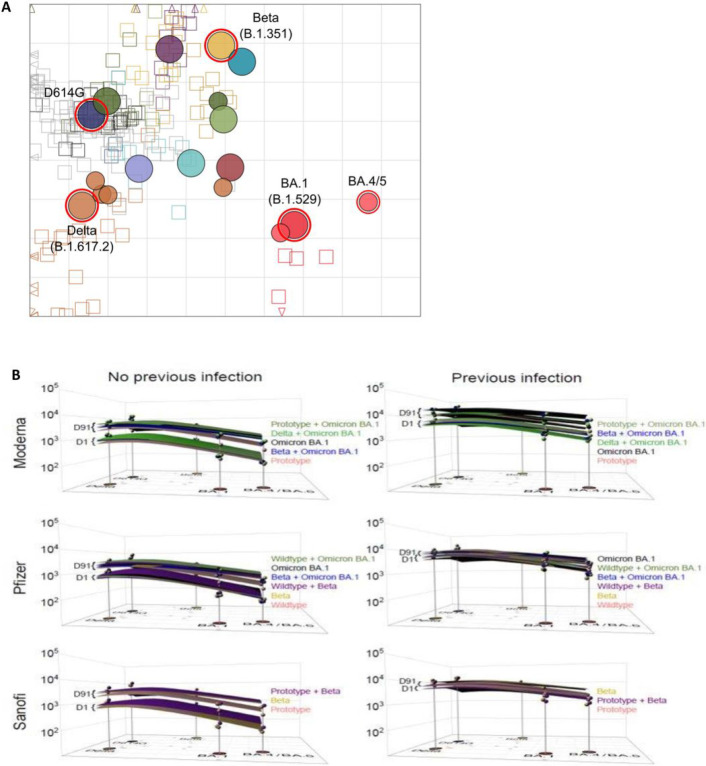
Figure 3. Antigenic Cartography.
A) An adapted version of the antigenic map by Wilks, et al.22 served as base map for all antibody landscapes. Virus variants are shown as filled circles, variants with additional substitutions from their root variant as smaller circles. Individual sera are displayed as open squares in the color of their root variant or grey for mRNA-1273 vaccinated sera, small dark squares represent clinical trial participants. One grid unit in the map corresponds to a two-fold dilution in the neutralization assay, within x- and y-axis the map orientation is free as antigenic distances are relative. Small triangles point to sera outside the shown map area.
B) Day 1 and Day 91 geometric mean titer (GMT) antibody landscapes for uninfected and infected individuals in different arms for the 3 stages. Impulses show the GMT against the specific variant. Lower landscapes correspond to Day 1 and upper landscapes to Day 91 immunity. To interpret landscapes, a Day 91 response where upper landscape is flat, indicates the responses to all the variants were equivalent, whereas, skewing up or down indicates an uneven response across variants. The surface colors represent study arms (Red: Prototype, Light Green: Prototype + Omicron BA.1, Black: Omicron BA.1, Dark Green: Delta + Omicron BA.1, Blue: Beta + Omicron BA.1, Purple: Beta + Prototype, Yellow: Beta).

