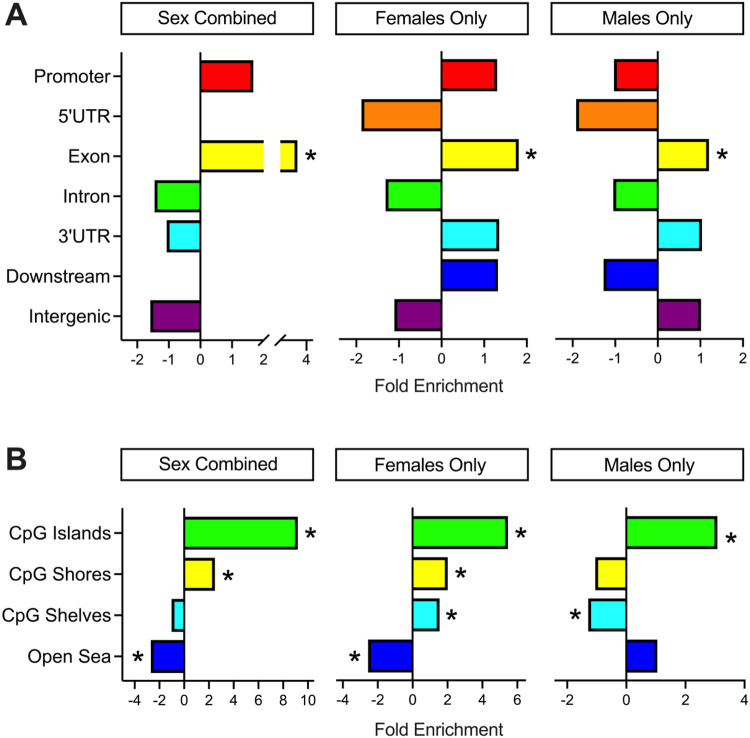
Figure 4. Annotation enrichments of CHD DMRs.
A) Genic and B) CpG enrichments of all significant (p <0.05) DMRs from Sex Combined, Females Only, and Males Only comparisons. DMRs were compared to background regions for each comparison and significance was determined by the Fisher’s test and FDR correction. * = q < 0.05.

