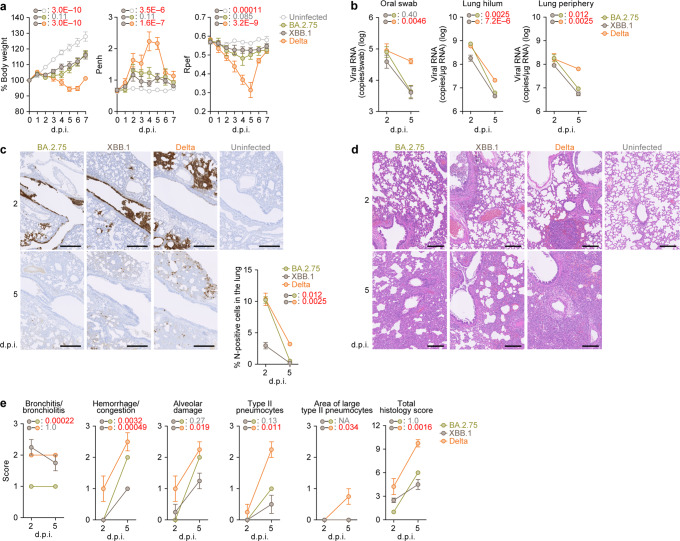
Fig. 6. Virological characteristics of XBB.1 in vivo.
Syrian hamsters were intranasally inoculated with BA.2.75, XBB.1 and Delta. Six hamsters of the same age were intranasally inoculated with saline (uninfected). Six hamsters per group were used to routinely measure the respective parameters (a). Four hamsters per group were euthanized at 2 and 5 days post-infection (d.p.i.) and used for virological and pathological analysis (b–e). a Body weight, enhanced pause (Penh), and the ratio of time to peak expiratory flow relative to the total expiratory time (Rpef) values of infected hamsters (n = 6 per infection group). b (Left) Viral RNA loads in the oral swab (n = 6 per infection group). (Middle and right) Viral RNA loads in the lung hilum (middle) and lung periphery (right) of infected hamsters (n = 4 per infection group). c Immunohistochemical (IHC) analysis of the viral nucleocapsid (N) protein in the lungs at 2 d.p.i. (top) and 5 d.p.i. (bottom) of infected hamsters. Representative figures (left, N-positive cells are shown in brown) and the percentage of N-positive cells in whole lung lobes (right, n = 4 per infection group) are shown. The raw data are shown in Supplementary Fig. 6. d, e, Hematoxylin and eosin (H&E) staining of the lungs of infected hamsters. Representative figures are shown in (d). Uninfected lung alveolar space and bronchioles are also shown. e Histopathological scoring of lung lesions (n = 4 per infection group). Representative pathological features are reported in our previous studies2,5,10,25–27. In (a–c), data are presented as the average ± standard error of mean (SEM). In (a, b, c, e), statistically significant differences between XBB.1 and other variants across timepoints were determined by multiple regression. In (a), the 0 d.p.i. data were excluded from the analyses. The familywise error rates (FWERs) calculated using the Holm method are indicated in the figures. Scale bars, 500 μm (c); 200 μm (d). Source data are provided with this paper.

