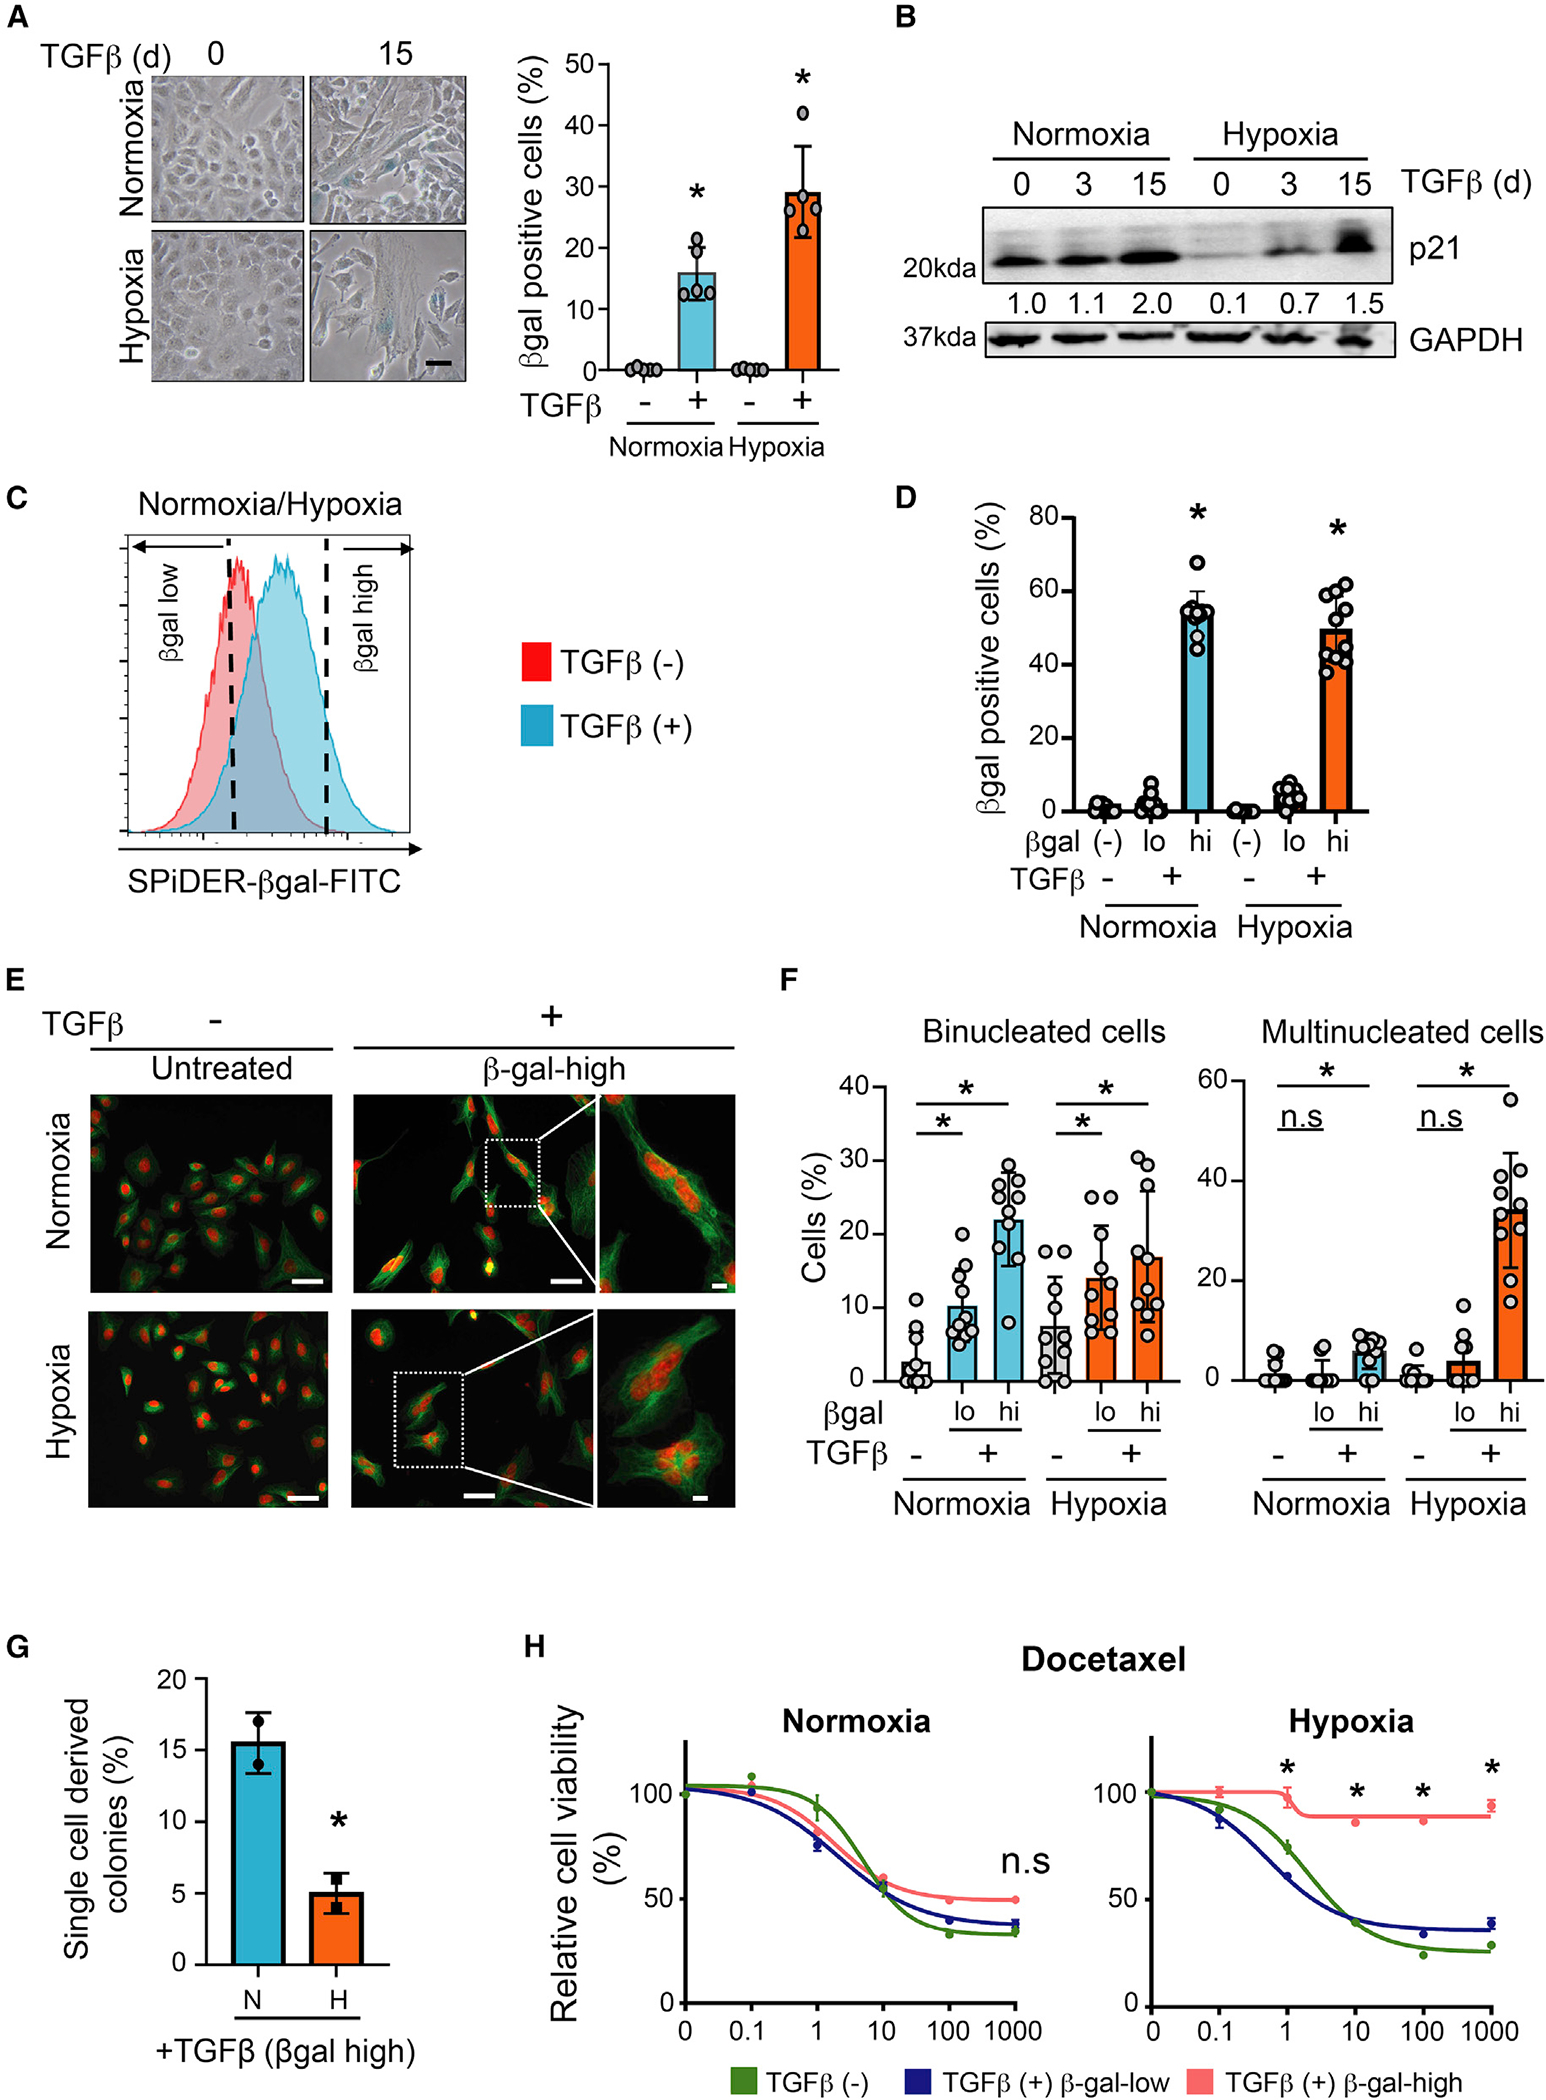
Figure 1. TGF-β induces different degrees of senescence depending on oxygen concentration.

(A) TGF-β induces senescence in normoxic and hypoxic cells. A549 cells were treated with 5 ng/mL TGF-β for 15 days and stained for β-gal activity. Left: photomicrographs of β-gal-stained untreated and TGF-β-treated cells. Scale bar: 20 μm. Right: quantification of percentage of β-gal-positive cells. Mean ± SD was calculated from imaging 10 random fields. *p < 0.05 by two-tailed unpaired Student’s t test; biological replicates.
(B) TGF-β induces p21 in normoxic and hypoxic cells. Western blot showing p21 protein in A549 cells treated with 5 ng/mL TGF-β for 0, 3, and 15 days. p21 band intensity quantification is provided below. p21 expression in untreated normoxic cells was set at 1. GAPDH was used as loading control; biological replicates.
(C) Schematic showing β-gal-high senescent population enrichment. TGF-β-treated hypoxic and normoxic A549 cells (5 ng/mL for 15 days) were sorted after SPiDER-βGal staining. β-gal-low and β-gal-high populations, defined as the bottom and top 20% of the observed distribution, respectively, were collected for downstream analysis. Representative data from three biological replicates are shown.
(D) The β-gal-low and β-gal-high populations collected as described in (C) were cultured for 24 h and stained for β-gal. Bar graph shows percentage of β-gal-positive cells in each condition. Untreated A549 cells were used as control. Mean ± SD was calculated from imaging 10 random fields. *p < 0.05 by two-tailed unpaired Student’s t test; biological replicates.
(E) Multinucleated cells are prevalent in TGF-β-treated hypoxic cultures. The β-gal-high cells collected from TGF-β-treated (5 ng/mL, 15 days) hypoxic and normoxic cultures were stained with DAPI (red) and tubulin (green). Untreated cells were used as control. Photomicrographs of cells under each condition are shown. Scale bar: 50 μm. Far right images: higher-magnification images of binucleated (upper, normoxia) and multinucleated (lower, hypoxia) cells in highlighted images. Scale bar: 10 μm. Representative data from two biological replicates are shown.
(F) Quantification of binucleated and multinucleated cells in β-gal-low and β-gal-high populations sorted from TGF-β-treated (5 ng/mL, 15 days) hypoxic and normoxic A549 cells. Untreated cells are shown as controls. Mean ± SD was calculated from imaging 10 random fields. *p < 0.05 by two-tailed unpaired Student’s t test; biological replicates.
(G) β-gal-high TGF-β-treated hypoxic cells exhibit reduced ability to resume proliferation. TGF-β-treated (5 ng/mL, 15 days) hypoxic and normoxic A549 cells were sorted for β-gal activity and seeded as single cells into 96-well plates. Colony formation of single cells in medium without TGF-β was monitored after 7 days. Bar graph shows fraction of wells with colonies for each condition; biological replicates; mean ± SD; *p < 0.05 by two-tailed unpaired Student’s t test.
(H) TGF-β-treated β-gal-high hypoxic cells are resistant to drug treatment. The β-gal-low and β-gal-high populations from TGF-β-treated hypoxic and normoxic A549 cells were cultured for a day without TGF-β and treated with increasing concentrations of docetaxel for 72 h. Graph shows relative viability of cells for each condition (y axis) under different drug concentrations (x axis). Untreated cells (TGF-β [−]) are shown as controls; biological replicates. *p < 0.05 by two-tailed unpaired Student’s t test. See also Figures S1 and S2.
