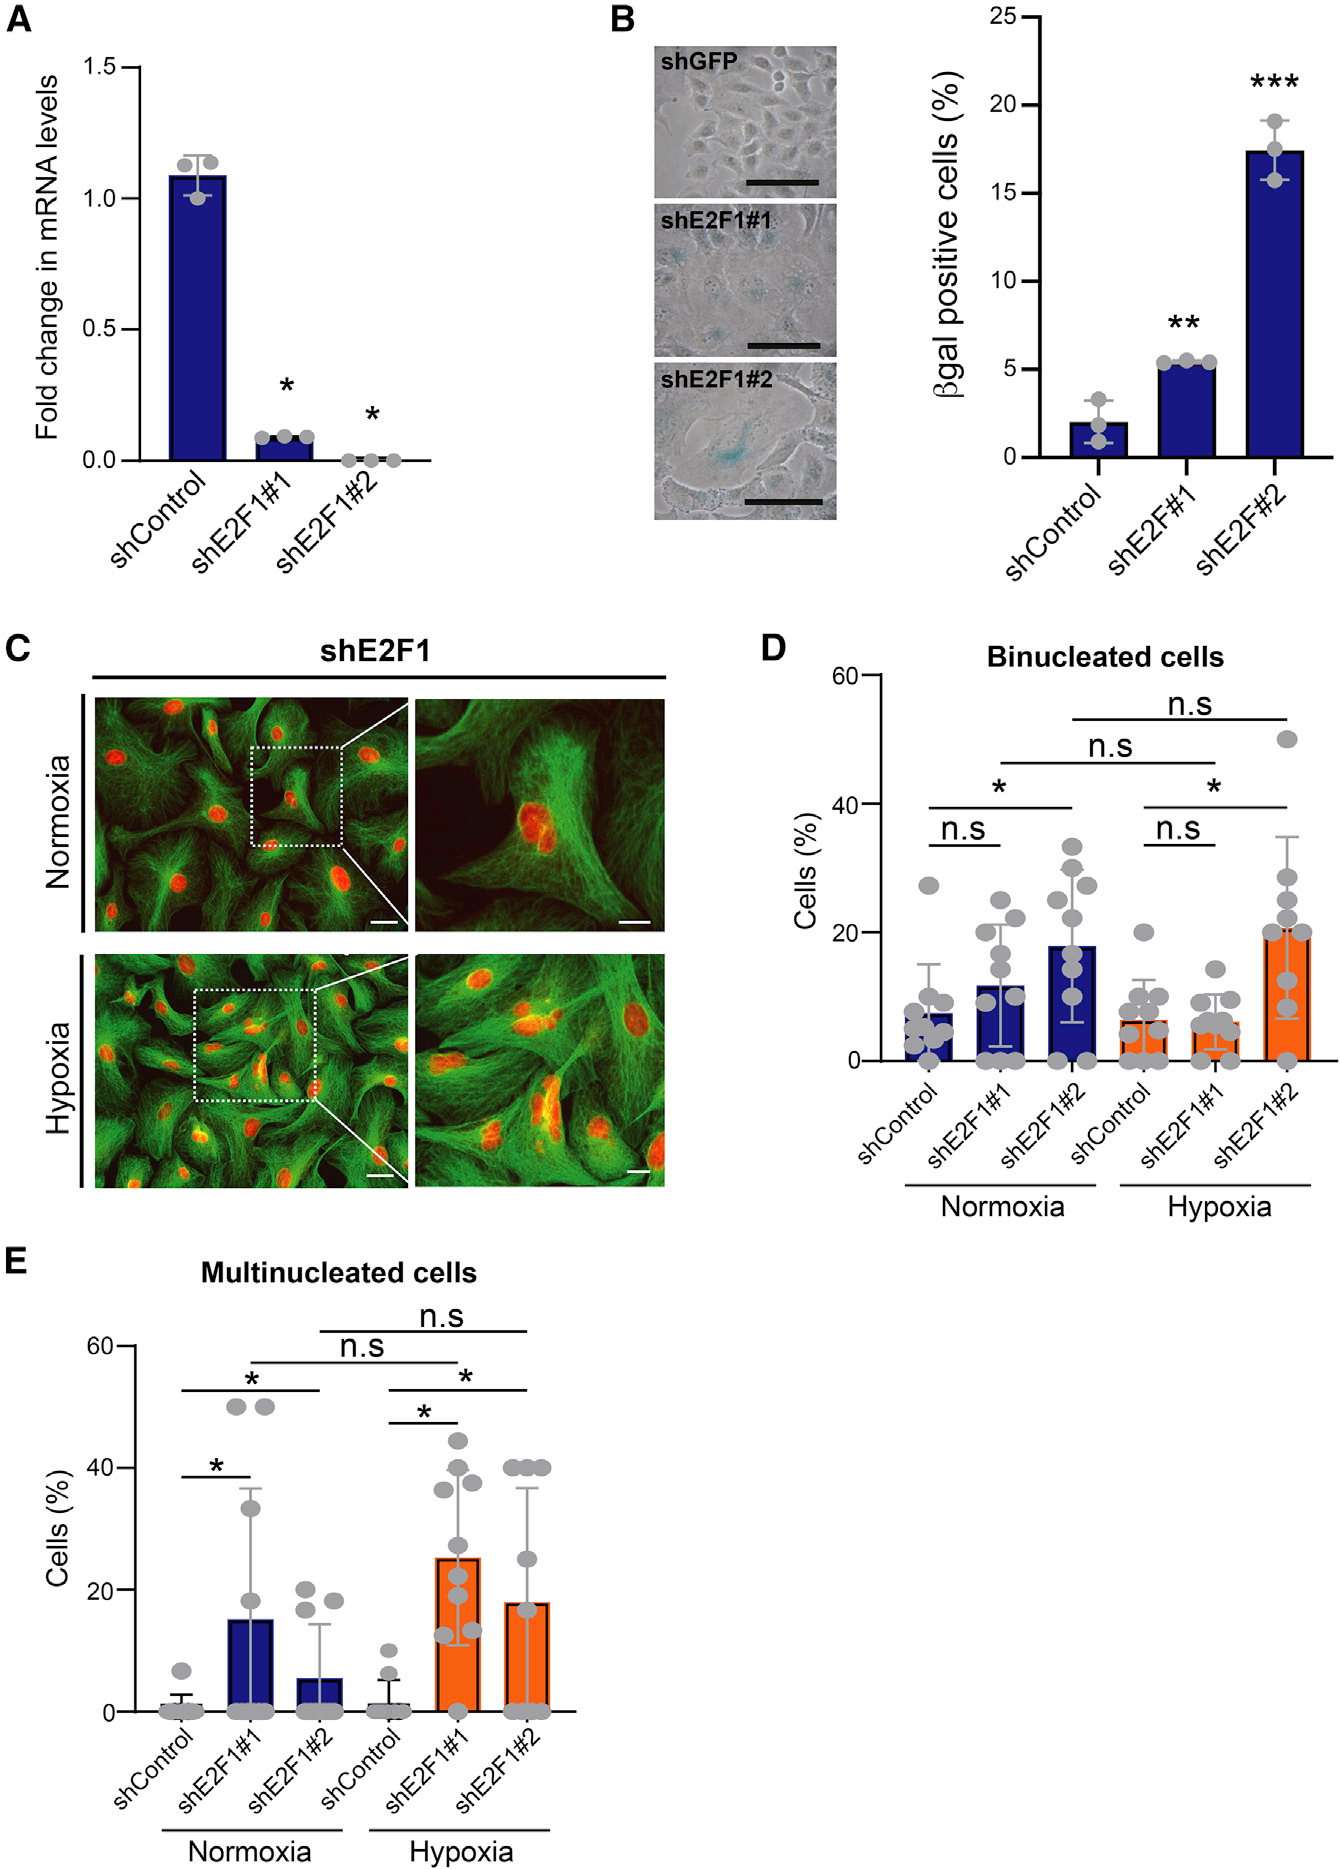
Figure 3. Suppression of E2F phenocopies in deep senescence.

(A) qPCR of relative E2F1 mRNAs in cells infected with two different E2F1 shRNAs. shGFP was used as control; biological replicates. Data are represented as mean ± SD; *p < 0.05 by Student’s t test.
(B) E2F1 suppression induces senescence. E2F1-KD A549 cells were stained for β-gal activity. Left: photomicrographs of β-gal-stained control and E2F1-KD cells. Scale bar: 50 μm. Right: percentage of β-gal-positive cells for each condition; biological replicates. Data are shown as mean ± SD; **p < 0.01 and ***p < 0.001 by two-tailed unpaired Student’s t test.
(C) E2F1 knockdown increases multinucleated cells irrespective of oxygen concentration. Control and E2F1-KD A549 cells were stained with DAPI (red) and tubulin (green). Left: photomicrographs of cells cultured under hypoxia and normoxia. Higher magnification of highlighted multinucleated cells is shown on the right. Scale bars: 50 μm (low magnification) and 20 μm (high magnification). Representative data from two biological replicates are shown.
(D and E) Bar graphs show percentage of binucleated (D) and multinucleated (E) E2F-KD A549 cells grown under hypoxia and normoxia. shGFP is shown as control; biological replicates. Mean ± SD was calculated from imaging 10 random fields. *p < 0.05 by two-tailed unpaired Student’s t test; n.s, not significant. See also Table S3.
