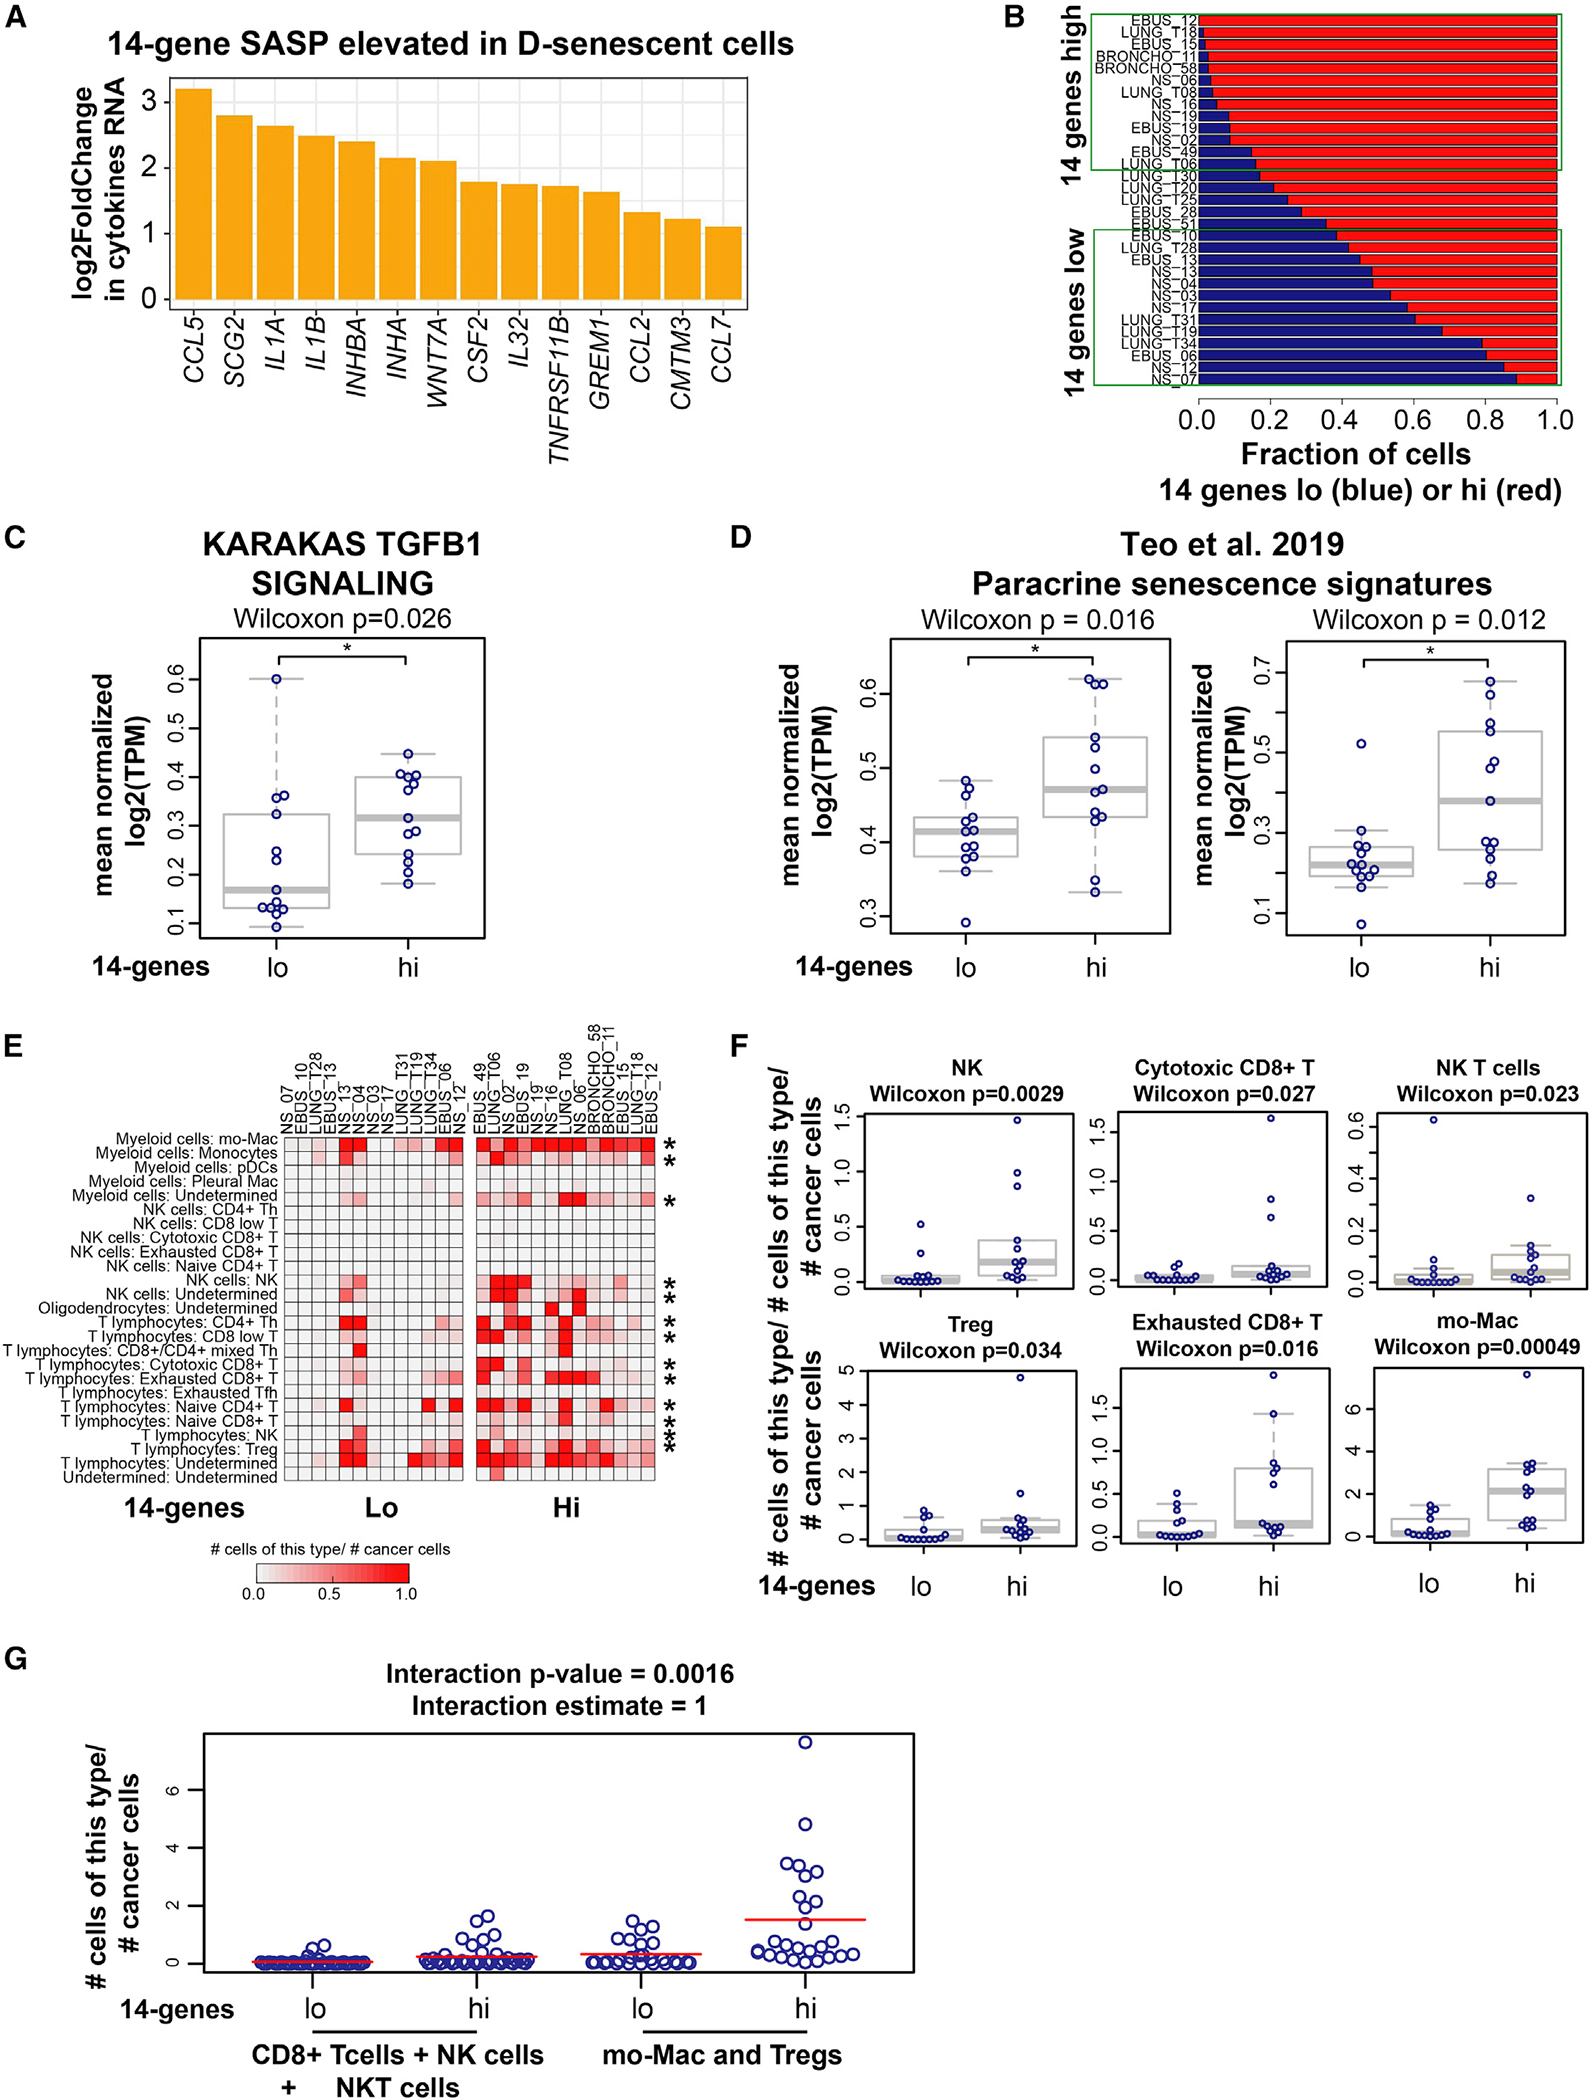
Figure 4. Lung cancers with high 14-gene SASP exhibit an immune-suppressive microenvironment.

(A) A 14-cytokine SASP is elevated in deep-senescent cells. Bar graph shows log2 fold change in cytokines/growth factors constituting the 14-gene SASP elevated in D-senescent cells compared with E-senescent cells; biological replicates for each condition (see Figures S4A–S4C). Significantly different cytokines were selected based on Benjamini-Hochberg corrected and >2-fold differences in gene expression.
(B) Stratification of 31 treatment-naive metastatic lung cancers based on the fraction of tumor cells with high and low 14-gene metagene signature in each patient. Fractions of 14-gene low (blue) and 14-gene high (red) cancer cells in each patient are shown. We defined the top 13 tumors harboring >80% of tumor cells expressing a high 14-gene signature as “14 genes high” and the bottom 13 tumors with <60% of tumor cells expressing the 14-gene signature as “14 genes low” (marked within the green boxes).
(C) TGF-β signaling is significantly elevated in the tumor cell compartment of the 14-gene-high NSCLCs compared with 14-gene-low samples (*Wilcoxon ).
(D) Paracrine senescence signatures23 (paracrine/OIS48 and secondary senescence from time course/top overlap only [*Wilcoxon ]; secondary senescence from co-culture/OIS from co-culture and secondary senescence from time course/OIS from time course overlap only [*Wilcoxon ]) are elevated in 14-gene-high treatment-naive NSCLCs compared with 14-gene-low NSCLCs.
(E) Increased immune cell infiltration in lung cancers with higher fraction of tumor cells with high-14-gene expression. Quantification of each class of tumor-infiltrating immune cells (normalized to the number of cancer cells in each sample) across 14-gene-high and 14-gene-low lung cancers is shown. Asterisks mark the immune cell subtype significantly elevated in 14-gene-high lung cancers. *p < 0.05 was calculated using two-sample two-sided Wilcoxon test.
(F) Boxplots showing the fraction of indicated immune cell type residing within each lung cancer sample in 14-gene-high and -low groups. p < 0.05 was calculated using two-sample two-sided Wilcoxon test.
(G) Plot showing that the net increase in immune cells in the 14-gene-high NSCLCs is biased toward increased infiltration of immune-suppressive cell types (Mo-Macs and Tregs) compared with cytotoxic cells (cytotoxic CD8+ T cells + NK cells + NK-T cells). The linear model used to analyze these data are described in the STAR Methods. The interaction estimate shows a positive value of 1, indicating that the mean for 14-gene-high patients minus the mean for 14-gene-low patients is significantly greater for immune-suppressive cells than for cytolytic cells with an interactive p value of 0.0016. See also Figures S4 and S5.
