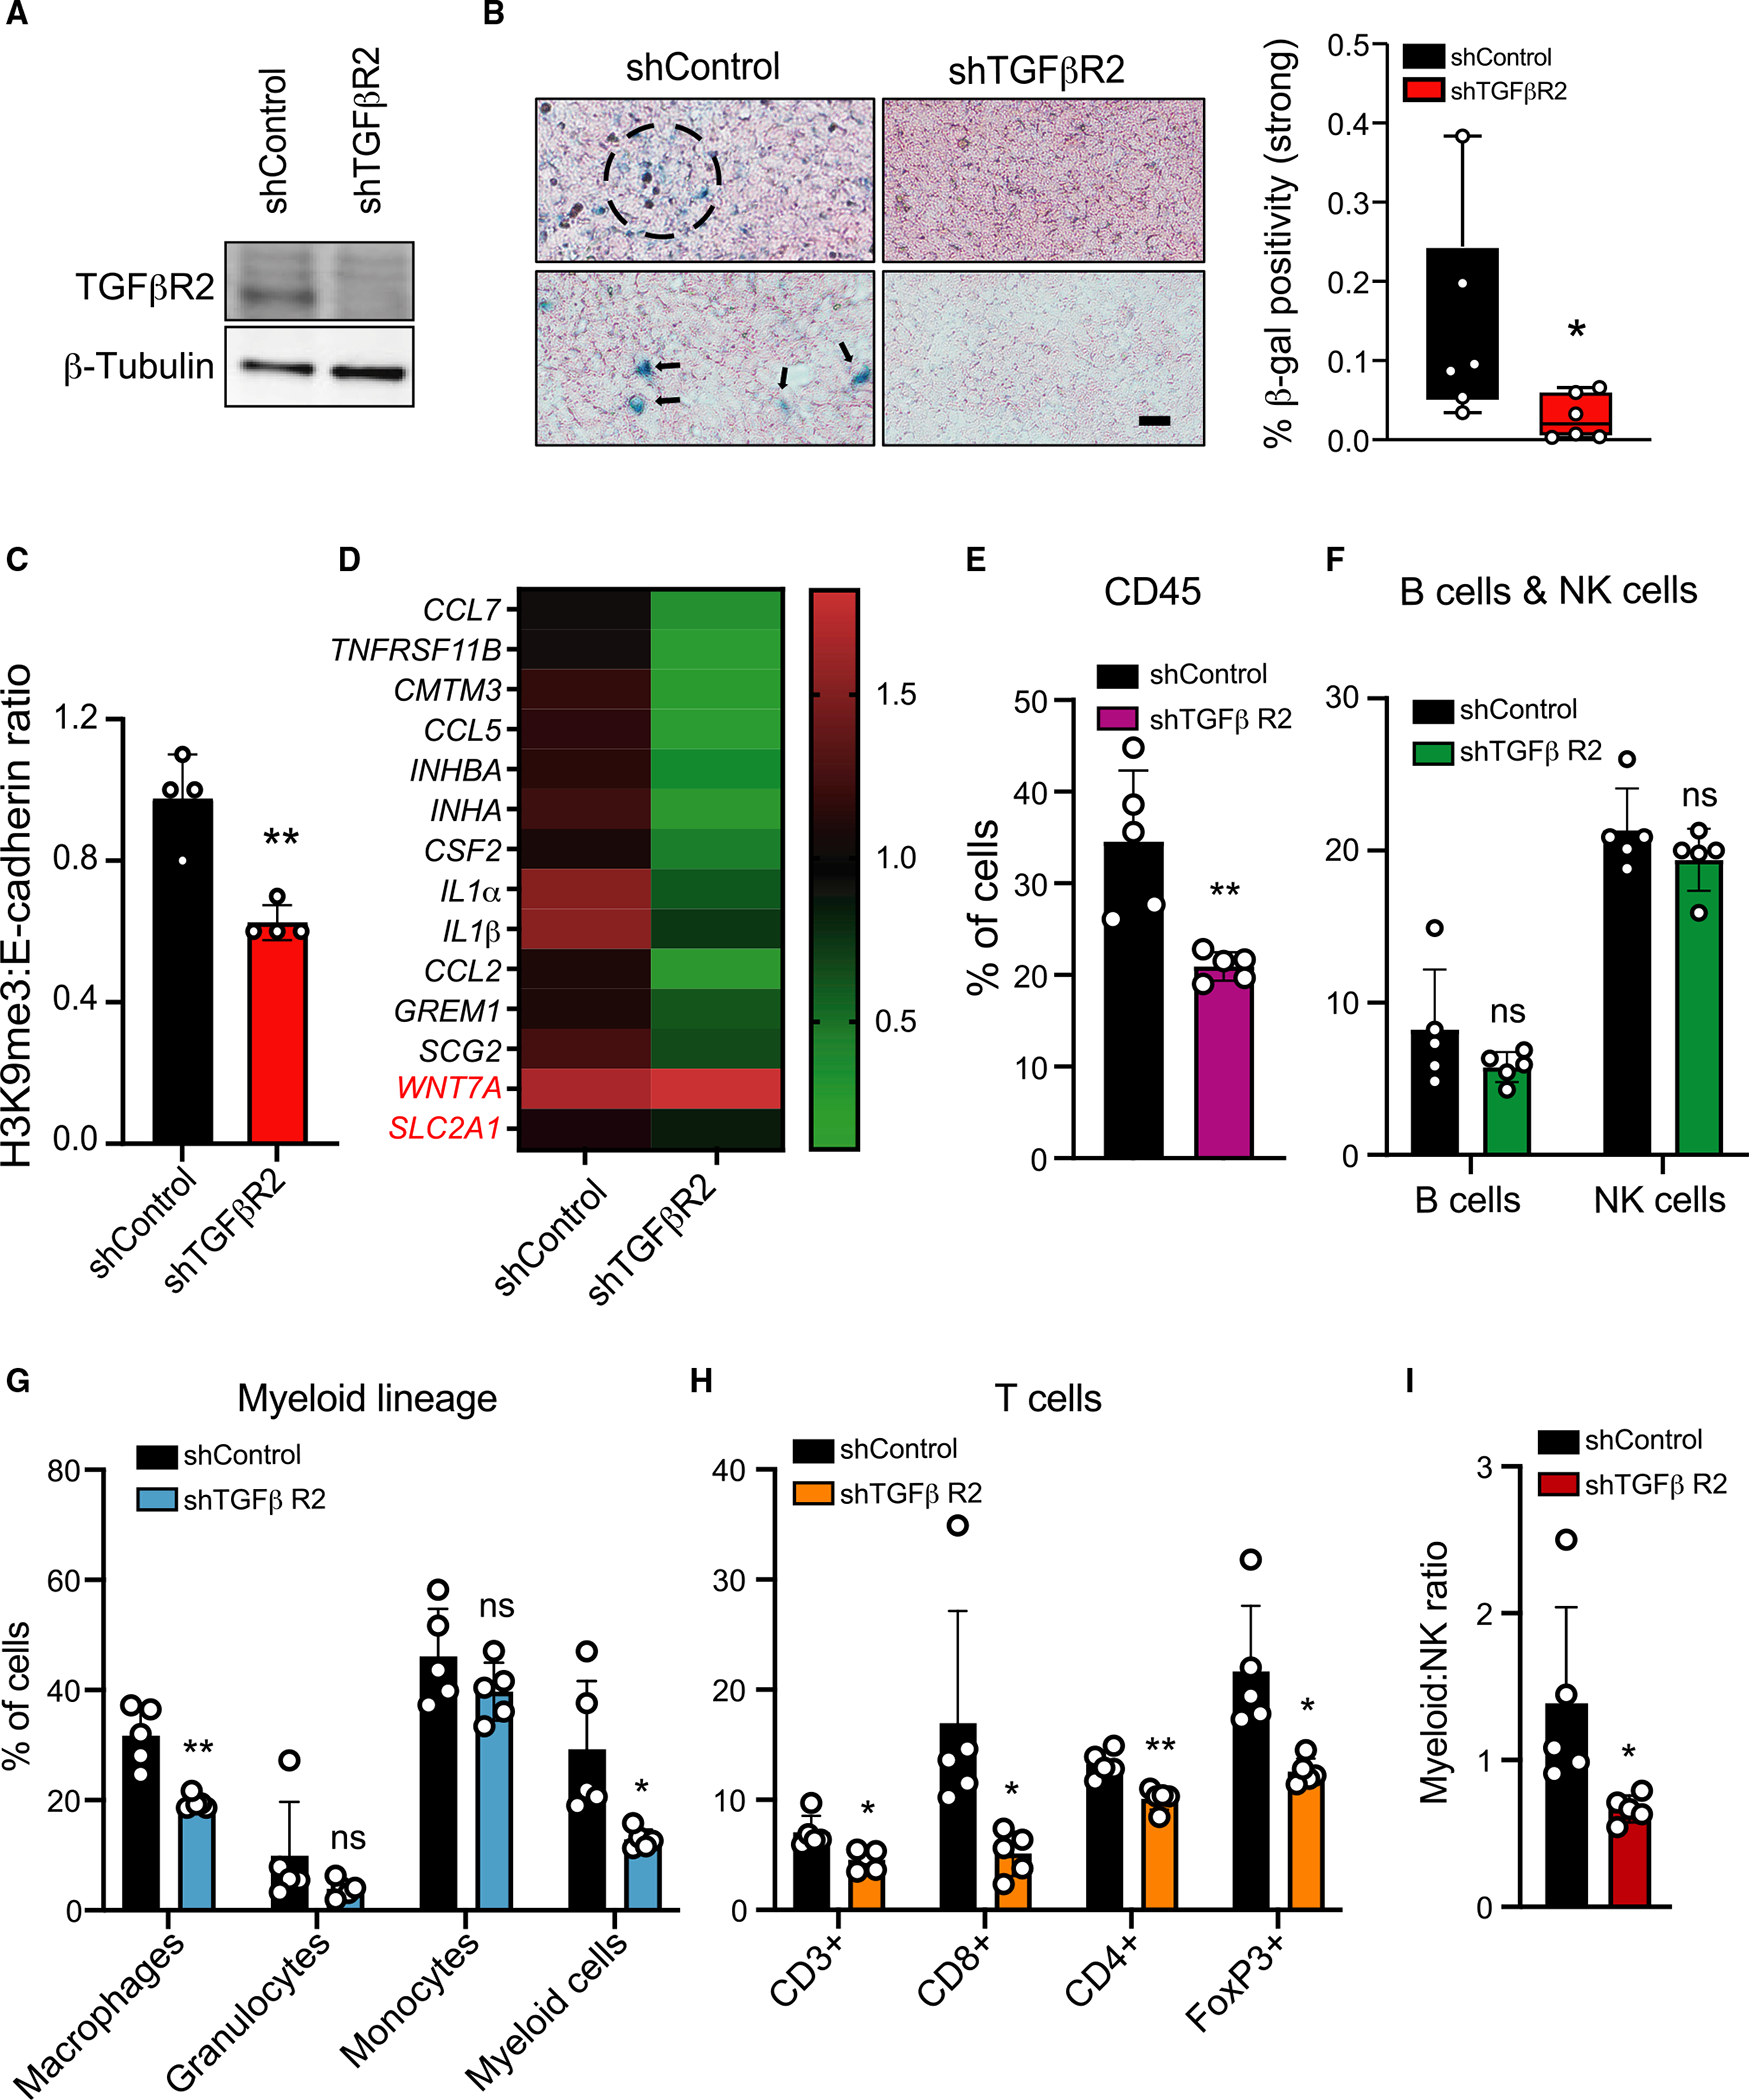
Figure 6. TGF-βR2-KD in tumor cells suppresses senescence and immune cell infiltration in an immune-competent mouse lung cancer model.

(A) Western blot showing knockdown of TGF-βR2 in LLC1. β-tubulin is shown as control.
(B) TGF-βR2-KD suppresses senescence in LLC tumors. shControl and TGF-βR2-KD LLC1 cells were inoculated into both flanks of C57BL/6 mice ( mice per group). Tumors resected after 14 days were stained for β-gal. Photomicrographs show β-gal-positive senescent cells present as single cells (arrows) or clusters (dashed circle) in two representative shControl tumors. Scale bar: 100 μm. Right: quantification of β-gal positivity in shControl and TGF-βR2-KD tumors; percentage of strong β-gal stain to total tissue area was computed and a Wilcoxon test was applied across the two conditions (*p = 0.026); tumors for each condition.
(C) The senescence marker H3K9Me3 is reduced in TGF-βR2-KD tumors. Quantification of western blot of proteins from shControl and TGF-βR2-KD tumors with antibodies against H3K9Me3 and E-cadherin. Bar graph shows the ratio of H3K9Me3:E-cadherin (H3K9Me3 expression in the epithelial tumor compartment) in tumors; tumors/condition. Bar graph shows mean ± SD. **p = 0.0021 by two-tailed unpaired Student’s t test.
(D) SASP activity is reduced in TGF-βR2-KD tumors. RNA from shControl and TGF-βR2-KD tumors was analyzed for 14-gene SASP expression. Heatmap shows fold change in expression; shControl was set at 1; tumors/condition. IL-32 is not expressed in mouse cells.
(E–H) TGF-βR2-KD in tumor cells suppresses immune cell infiltration. Immune cells in shControl and TGF-βR2-KD tumors were quantified by FACS after staining for immune cell subtypes shown. The percentage of each immune cell type in shControl and TGF-βR2-KD tumors is shown. Significant decreases were observed in CD45+ cells (), CD3+ T cells (), CD8+ T cells (), CD4+ Tregs (), FoxP3+ Tregs (), macrophages (), and myeloid cells () in shTGF-βR2-KD tumors. Granulocytes, monocytes, B cells, and NK cells were not significantly altered (ns); tumors/condition. Bar graphs shows mean ± SD. The p values *p < 0.05 and **p < 0.01 were calculated by multiple unpaired Student’s t test.
(I) TGF-βR2-KD in tumors significantly reduced the ratio of myeloid:NK cells compared with shControl tumors; tumors/condition; *p = 0.04 calculated by two-tailed unpaired Student’s t test. Also see Figure S7.
