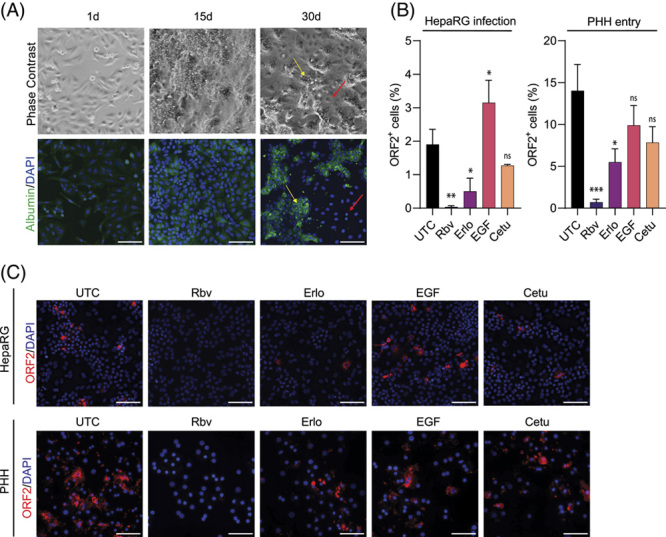
FIGURE 6.

The critical entry effect of EGFR was verified in HepaRG cells and PHHs. (A) Phase contrast and immunofluorescence images of HepaRG cells during differentiation. The yellow arrow indicates hepatocyte-like cells, red arrow cholangiocyte-like cells. (B, C) HEVcc (p6) infection in differentiated HepaRG cells under EGFR modulator treatment during the full infection time of 5 d or PHH only during entry, meaning a 30 min pretreatment with EGFR modulators before infection with HEVcc (p6) for 16 h under modulator treatment, after 3 d incubation time without inoculum or modulators. [erlotinib (33 µM, Erlo), EGF (16.5 nM), and cetuximab (34 nM, Cetu) compared with UTC, whereas 25 µM of the HEV inhibitor ribavirin (Rbv) served as control]. (B) Quantification of ORF2-positive cells by CellProfiler analysis in percent of all counted DAPI nuclei per image and (C) representative fluorescence images stained against ORF2 protein. Infection experiments were performed in duplicates, with at least 10 images taken for analysis per experiment. To test the significance of mean differences, one-way ANOVA, followed by Dunnett multiple comparison test (D), was used, p-values <0.05 (*), <0.01 (**), <0.001 (***), and <0.0001 (****). p-values >0.05 were considered to be ns. Mean and SEM are depicted from 2 (HepaRG) or 4 (PHH) independent experiments. Scale bars = 100 µm. Abbreviations: ns, nonsignificant; ORF2, open reading frame 2; PHH, primary human hepatocyte; UTC, untreated control cells.
