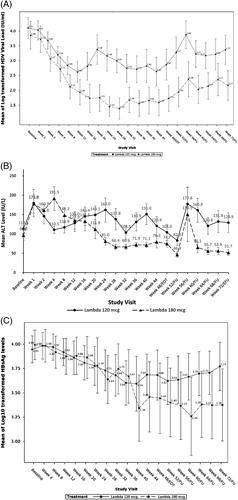
FIGURE 2.

Virological, biochemical, and serological response to treatment, according to treatment group. Mean HDV RNA (A), ALT (B) and HBsAg (C) levels over time, in the two treatment groups. Abbreviations: ALT, alanine aminotransferase; HDV, hepatitis D virus; HBsAg, hepatitis B surface antigen.
