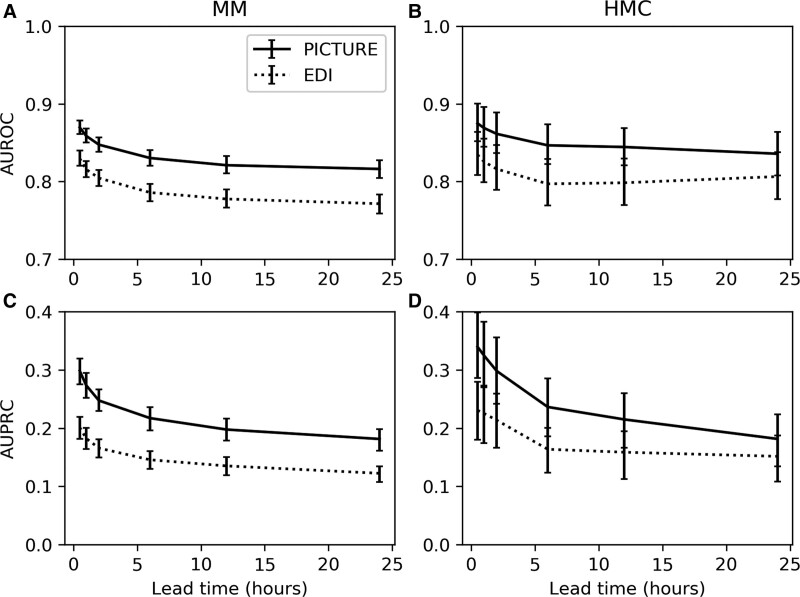
Figure 2.
Lead time simulation. Area under the receiver operating characteristic curve (AUROC) and area under the precision-recall curve (AUPRC) were evaluated for Predicting Intensive Care Transfers and other UnfoReseen Events (PICTURE) and Epic Deterioration Index (EDI) by calculating the maximum prediction score prior to x hr before the deterioration event, with x ranging from 0.5 to 24 hr. Twenty-four hr was selected as the limit since, during model training, only observations less than 24 hr in advance of the deterioration were labeled as positive. AUPRC is again adjusted to the event rate of 2.5% to match the second hospital (Hurley Medical Center [HMC]). Error bars representing 95% CIs are reported using the 1,000-replicate bootstrap described previously. A, AUROC at hospital 1 (Michigan Medicine [MM]) for PICTURE and EDI scores. B, AUROC at hospital 2 (HMC). C, AUPRC at MM. D, AUPRC at HMC.

