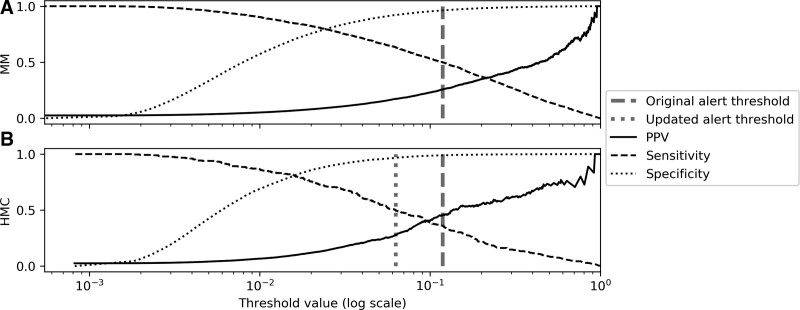
Figure 3.
Positive predictive value (PPV), sensitivity, and specificity change with alert threshold. PPV, sensitivity, and specificity are plotted at varying thresholds. A candidate threshold was selected at a sensitivity of 0.5 using data from hospital 1 (A, dark dashed line), and then applied to data from hospital 2 (B, dark dashed line). Note that PPV at hospital 1 is adjusted to reflect the event rate at the second institution. A second candidate alert threshold (light dotted line) was chosen using the same procedure on data from hospital 2 to indicate the possible desirability of choosing separate thresholds to better fit clinical care in the different environments. HMC = Hurley Medical Center, MM = Michigan Medicine.

