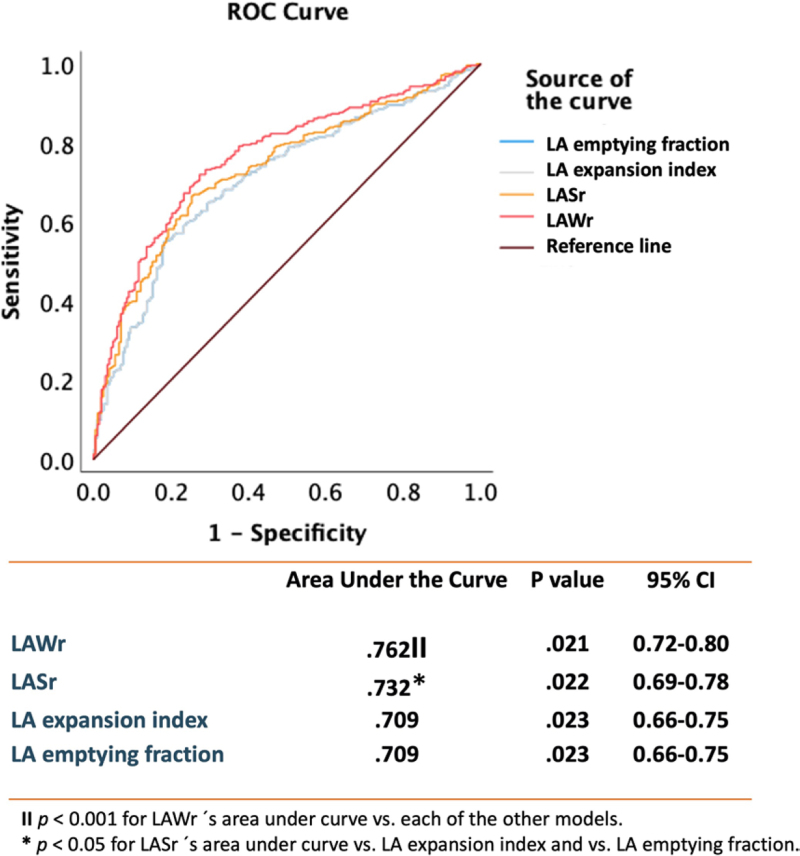
Figure 3.
Receiver operating characteristic (ROC) analysis showing the strength of the univariable relationship between different indexes of left atrial (LA) reservoir function (LA reservoir work [LAWr], LA reservoir strain [LASr], LA emptying fraction, and LA expansion index) and all-cause death. The table shows the areas under the curve (column 2) with the P value for the association between each index of LA reservoir function and all-cause death (column 3) and the 95% CIs (column 4). Additionally, the P values for the comparison between the areas under the curve of the 4 indexes of LA reservoir function are indicated by the symbols ‖ and *. ‖P<0.001 for LAWr area under the curve vs each of the other models. *P<0.05 for LASr area under the curve vs LA expansion index and vs LA emptying fraction.

