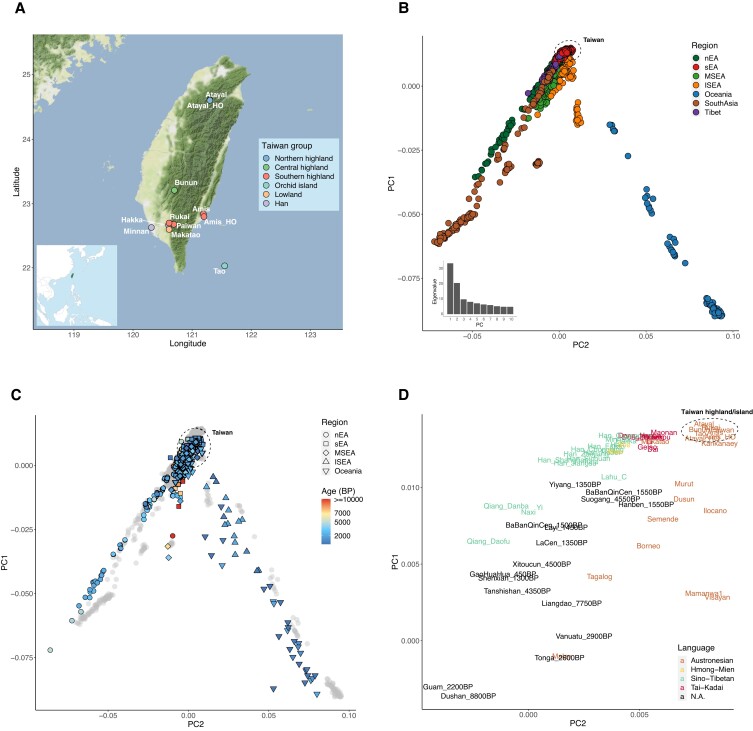
Fig. 1.
Map of the sampled Taiwanese groups and PCA of the modern/ancient individuals from South Asia, East Asia, and Oceania. A) Sampling locations of the Taiwanese populations. Map tiles by Stamen Design (CC BY 3.0), data by OpenStreetMap (ODbL). The Atayal_HO and Amis_HO are from published Human Origins data. The small map panel on the bottom-left indicates Taiwan (green) in the geographical context of East Asia. B) PCA of the modern individuals from South Asia, East Asia, and Oceania in the merged data set, colored by regions. The dashed circle indicates where the Taiwanese individuals fall. The eigenvalues from PC1 to PC10 are shown on the bottom-left. C) PCA with the ancient individuals projected onto the PCA in B) with the modern individuals in gray. Symbol shapes indicate region and colors indicate age (D). Zoom-in of C) with a focus on the modern groups from sEA and ISEA and the ancient groups from sEA and Lapita-related Oceania, colored by languages. The position of a group is the median of the positions of individuals from the group.

