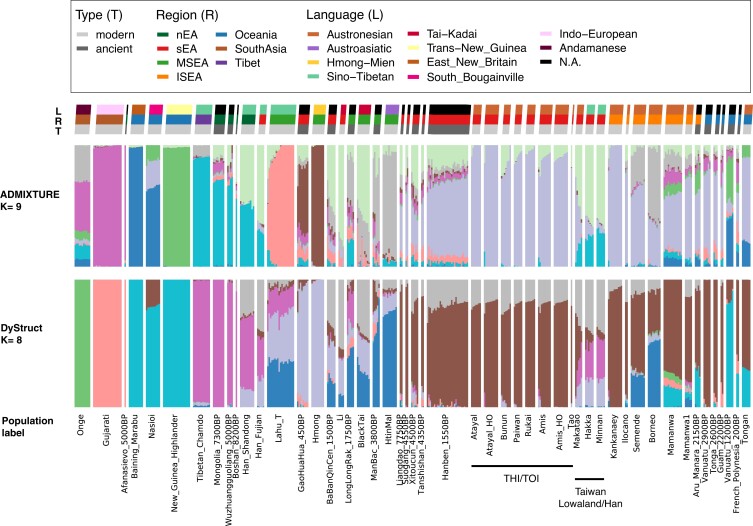
Fig. 2.
K = 9 of ADMIXTURE and K = 8 of DyStruct for selected representative groups. Both number of K are the best-fitting K for ADMIXTURE/DyStruct (Fig. S2). From the top to the bottom, there is a legend for the following three rows of keys indicating the language (L), the region (R), and the type of ancient/modern genomes (T) for the populations; below the keys, there are two rows showing the results of ADMIXTURE and DyStruct, respectively; the last row indicates the specific population label. Each vertical thin bar represents an individual, and different populations are separated with gaps. Representative groups are selected based on their enrichment of a source component, e.g. Andamanese, Indo-European, Papuan (Trans-New Guinea, East New Britain, South Bougainville), Sinto-Tibetan/nEA, Hmong-Mien, Austroasiatic, or their relevance to the into-/out-of-Taiwan events, e.g. Tai-Kadai, sEA, Taiwan, ISEA, and Oceania. Results of the full data set are presented in Fig. S3.

