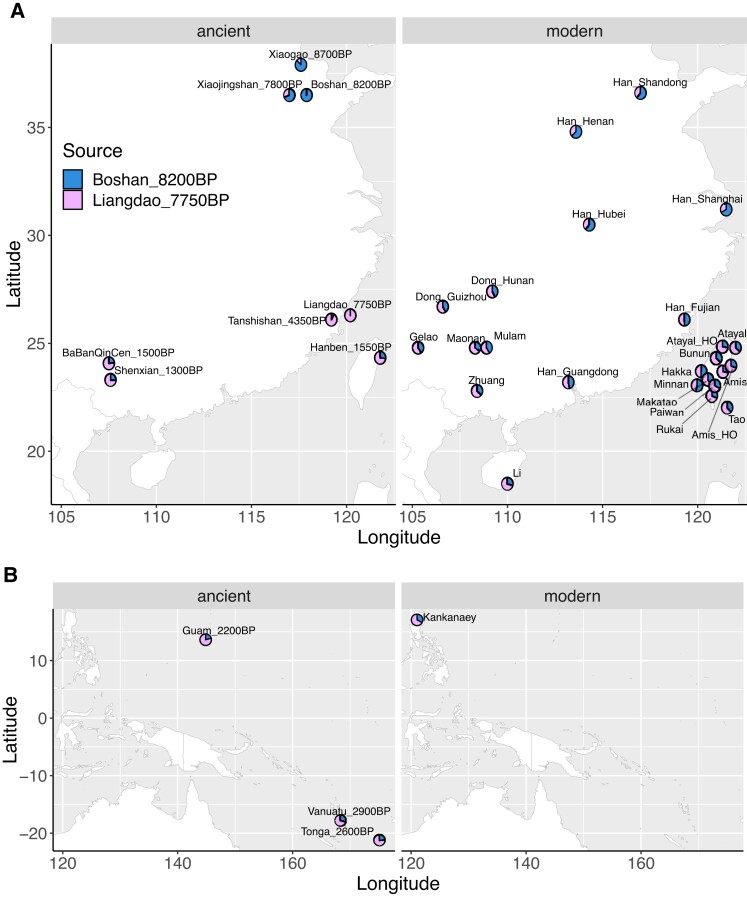
Fig. 4.
qpAdm modeling of the spatiotemporal dynamic of nEA versus sEA ancestries in East Asia and Oceania. Using outgroups shown in Fig. S8, selected groups from (A) nEA and sEA as well as (B) ISEA and Oceania (with a focus on those related to the early Out-of-Taiwan groups) are modeled with nEA (in blue, the ∼8.2 kya Boshan as proxy) and sEA (in pink, the ∼7.7 kya Liangdao as proxy) sources. The left panels show ancient groups while the right panels show modern groups. Bar plot visualization with the standard errors of the estimates is shown in Fig. S9.

