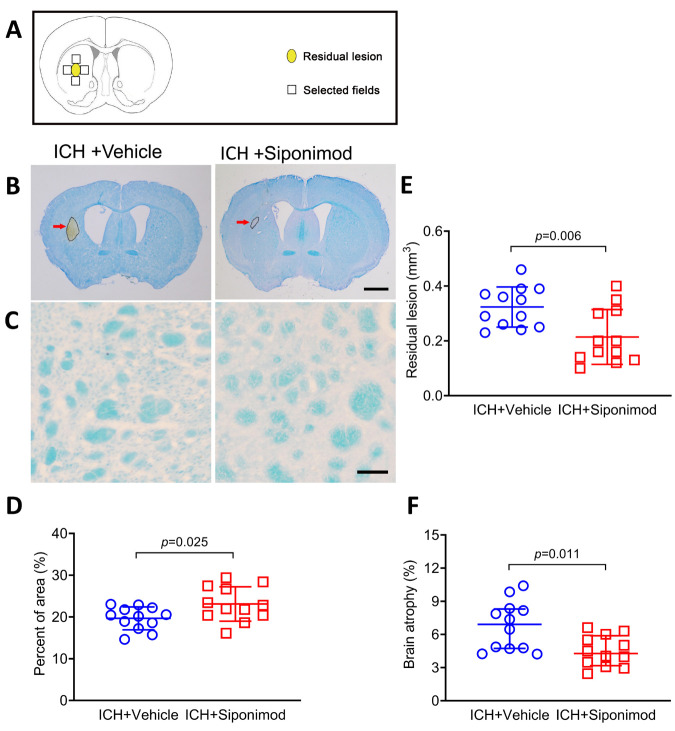
Figure 2.
Siponimod treatment reduced the volume of brain lesions, myelin loss, and brain atrophy on day 28 after ICH. (A) The schematic diagram indicated where in the ICH brain for white matter damage measurements. (B) Representative images of brain sections stained with LFB/CV on day 28. The areas of the lesions are circled with the black curve (the red arrow indicated); scale bar = 1 mm. (C) LFB-stained myelin from brain sections in the perihematomal region on day 28. Scale bar = 1 mm. (D). Quantitative analysis of white matter damage. Treatment with siponimod reduced the loss of LFB-stained myelin in the perihematomal region. The t-test for the analysis of white matter damage. n = 12 mice per group. (E-F) Brain lesion volume and atrophy were measured in LFB/CV-stained brain sections. The scattergram shows the quantitative analysis of residual lesion volume (E) and brain atrophy (F). The t-test for the analysis of the volume of residual brain lesion, the Mann-Whitney U test for the analysis of brain atrophy. n = 12 mice per group. Data for brain atrophy are presented as median and IQR; other data are expressed as mean ± SD.

