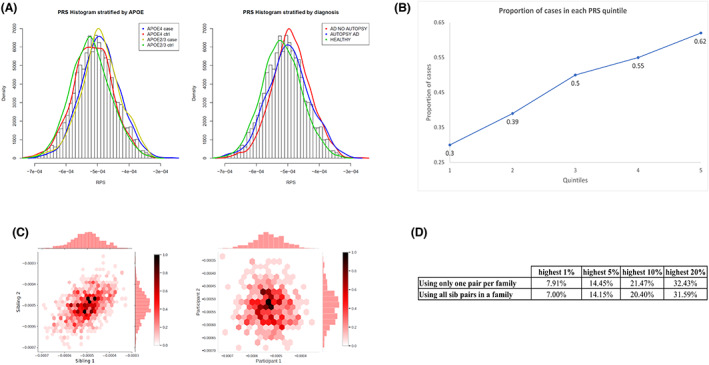
Figure 1.

PRS in the NIALOAD dataset. (A) Distribution of PRS by AD and APOE‐ε4 status in NIALOAD cohort (left) and distribution of PRS in clinical and autopsy confirmed AD and healthy controls (right). (B) Proportion of cases by each quintile of the PRS (NIA‐LOAD). (C) Correlation of PRS in siblings and unrelated pairs of individuals. One sibling pair was randomly selected from each family (666 families) to construct a dataset. This process was repeated 100 times. The paired correlation between the PRS of siblings and p‐value were calculated for each dataset. The average sibling correlation of PRS in the 100 iterations was 0.52. Among 846 unrelated individuals, were created random pairs and computed the PRS correlation for comparison. The left panel shows sibling correlation of PRS for one instance (correlation = 0.50 and p = 6.1e‐60). The right panel shows the PRS correlation among pairs of unrelated individuals −0.06 (p = 0.23). (D) Percentage of siblings with PRS in the highest 1st, 5th, 10th and 20th percentile when the other sibling also has PRS within that threshold.
