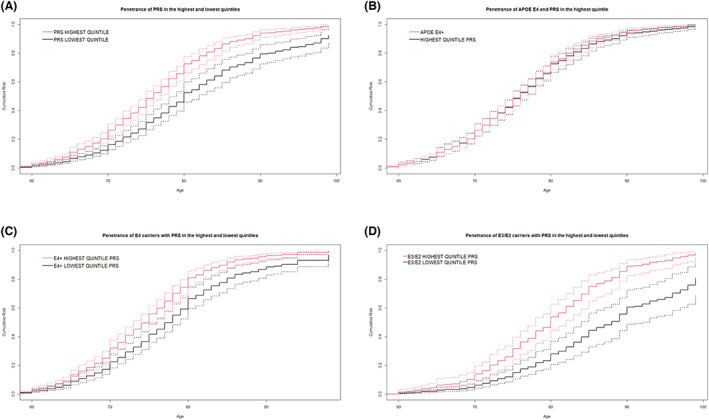
Figure 2.

Age specific cumulative penetrance comparisons between various groups. The solid lines represent the point estimates of penetrance from 1000 iterations and the dotted lines show the 95% confidence intervals. (A) Age‐specific cumulative penetrance of highest quintile and lowest quintiles PRS. (B) Age‐specific cumulative penetrance in highest quintile PRS versus APOE‐ε4 allele. (C) Age specific cumulative penetrance in highest and lowest quintile PRS among APOE‐ε4 carriers. (D) Age specific cumulative penetrance of highest quintile and lowest quintile PRS among APOE ε4 non‐carriers (APOE ε3 or ε2 carriers).
