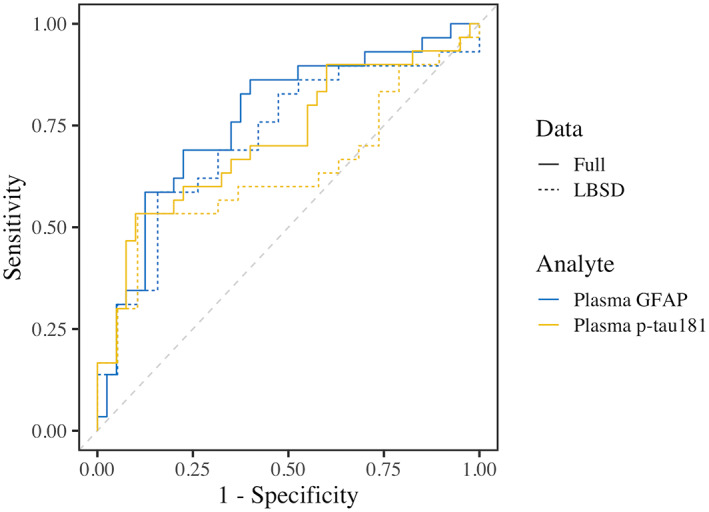
Figure 4.

Receiver operating characteristic (ROC) curves. Color indicates plasma GFAP (blue) and p‐tau181 (yellow). Solid lines represent the full autopsy dataset (αSyn, αSyn+AD, and AD), and dotted lines represent LBSD αSyn‐positive cases (αSyn, αSyn+AD). The dashed gray line represents chance performance. AUCs were 0.77 for full sample GFAP, 0.71 for LBSD sample GFAP, 0.72 for full sample p‐tau181, and 0.64 for LBSD sample p‐tau181.
