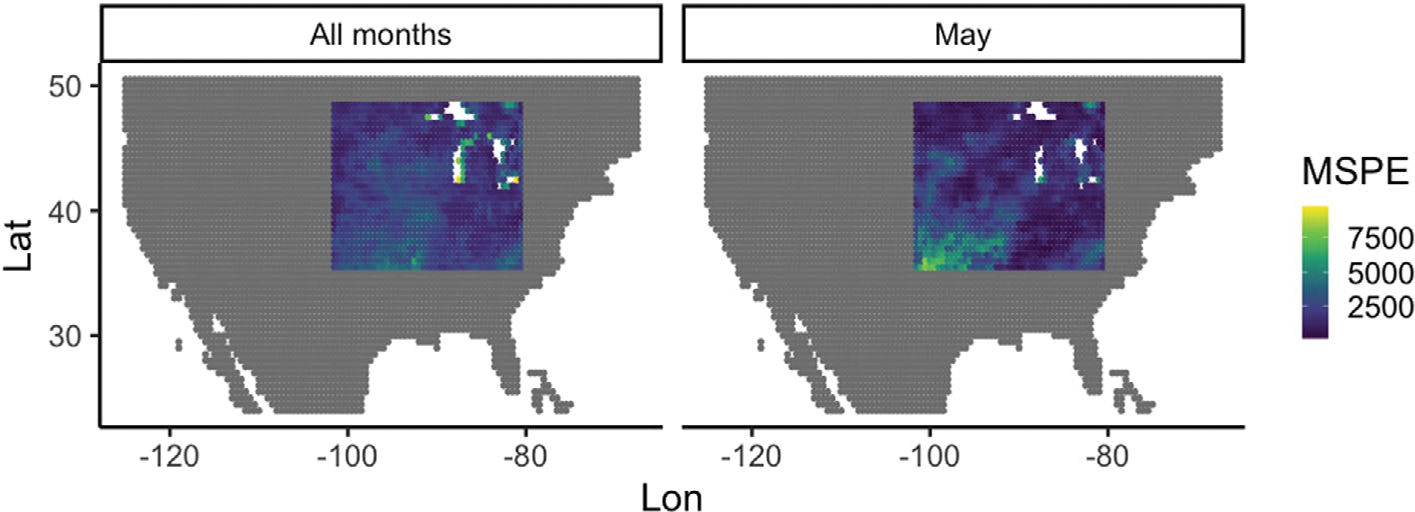
FIGURE 4.

Map of MSPE for SM data from the functional linear model at each location in the US corn belt for all months (left) and only May months (right). Note the agreement (low error) is quite good in large swaths of belt for all months, and similarly good in all but the southwest region for the May months.
