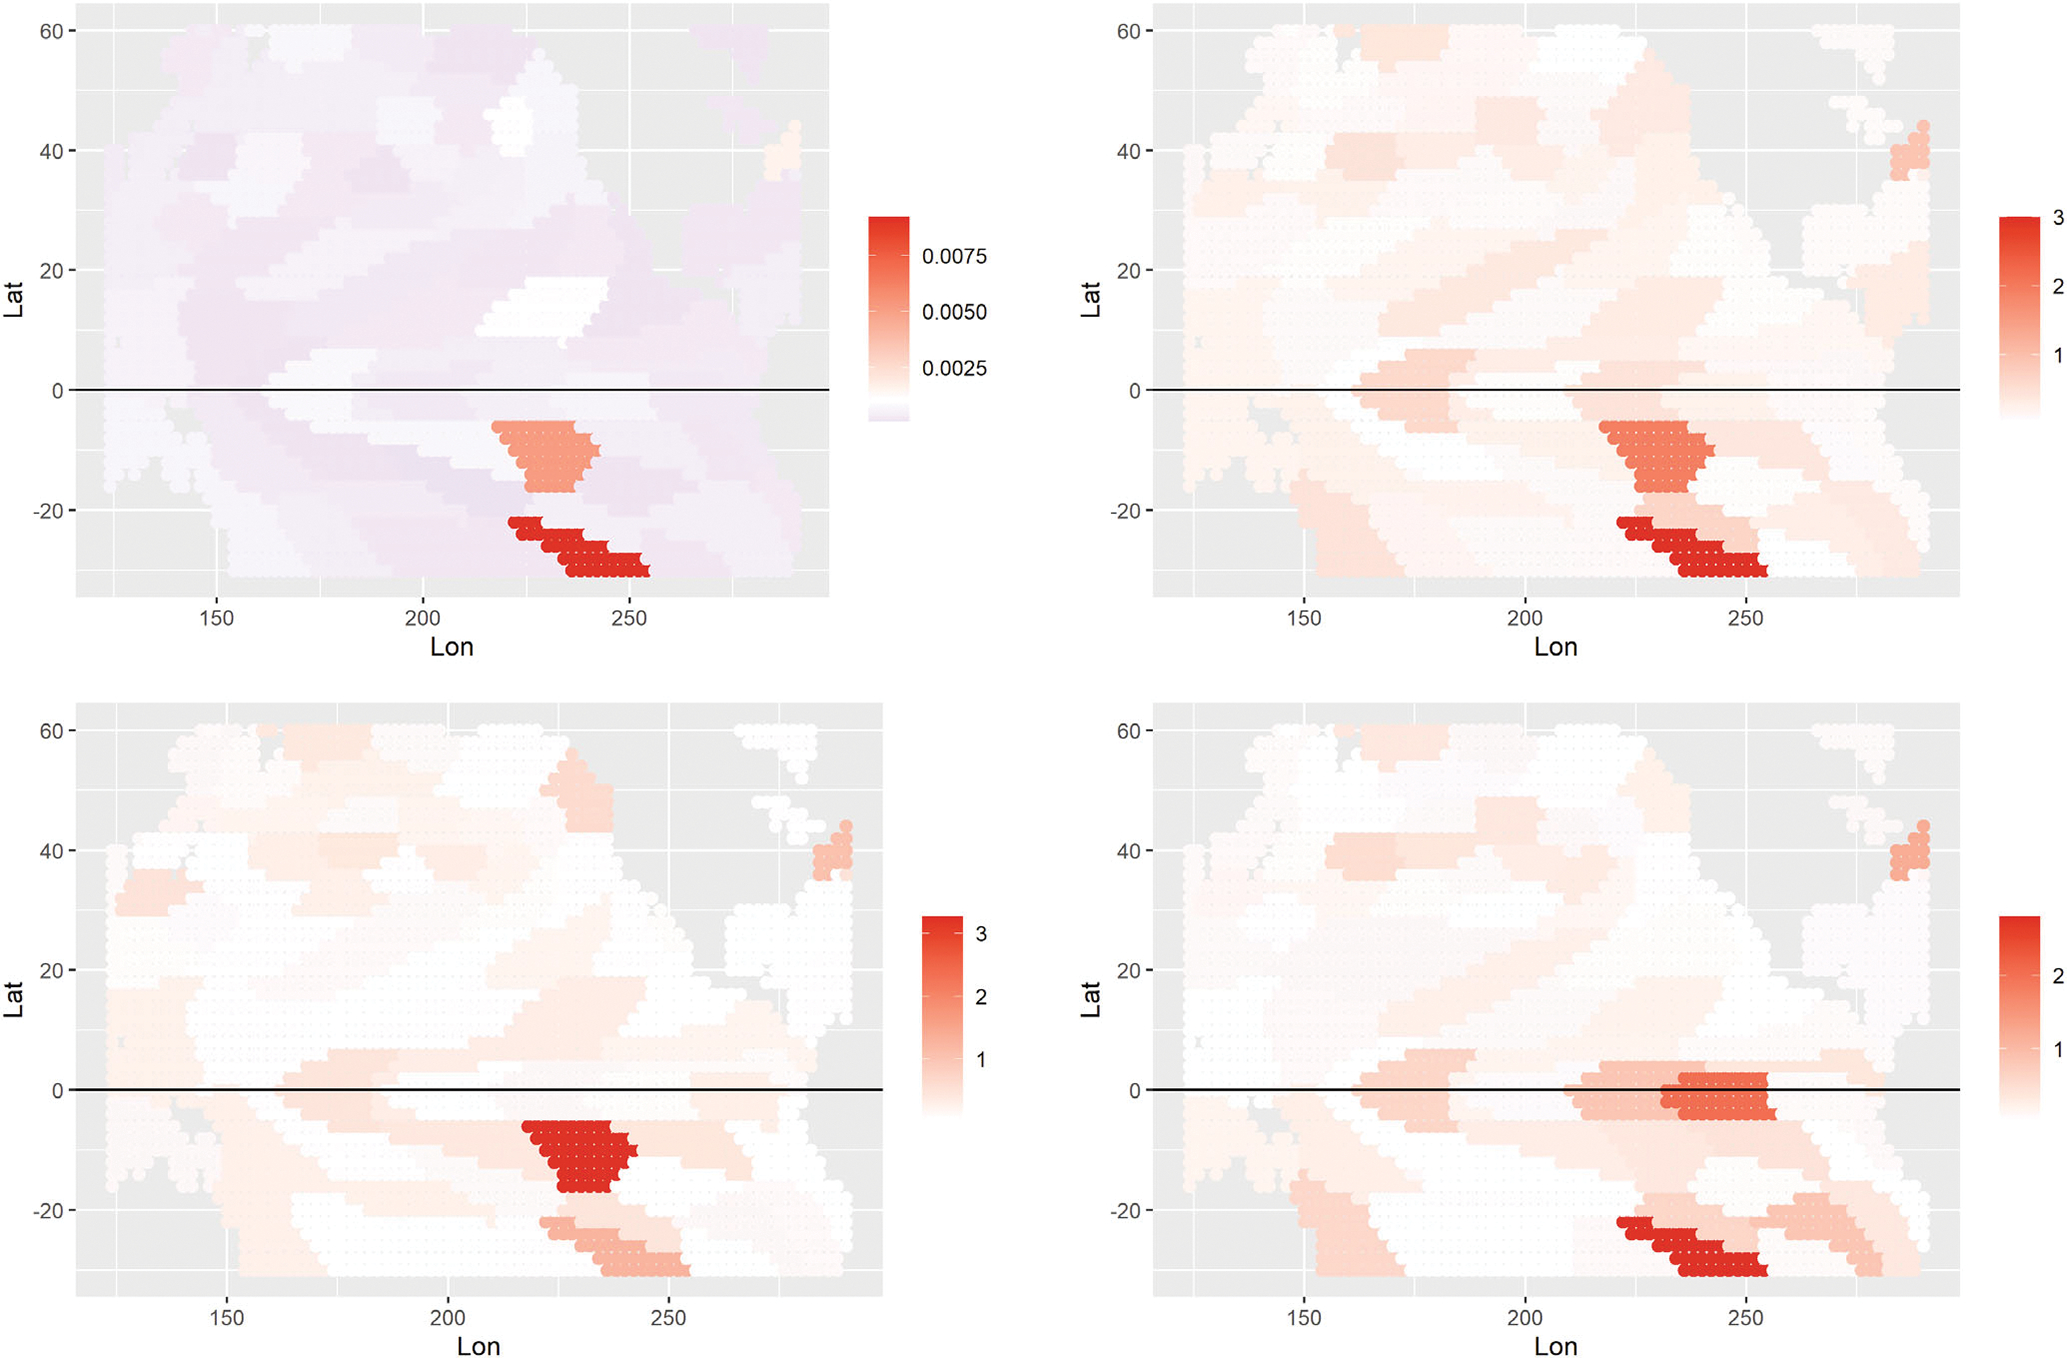
FIGURE 6.

Interpretability plots for the XGBoost model for 3-month long lead forecasts of SM in the corn belt: (Top left) the overall gain for SSTA features in the XGBoost model; (Top right) mean absolute Shapley values over all months; (Bottom) absolute values of the Shapley values for the XGboost model for 2016 (left) and 2021 (right), with darker red indicating higher SSTA increasing the SM in the corn belt. These values are averaged over all locations in the corn belt. The scale bars vary with instance to facilitate interpretation.
