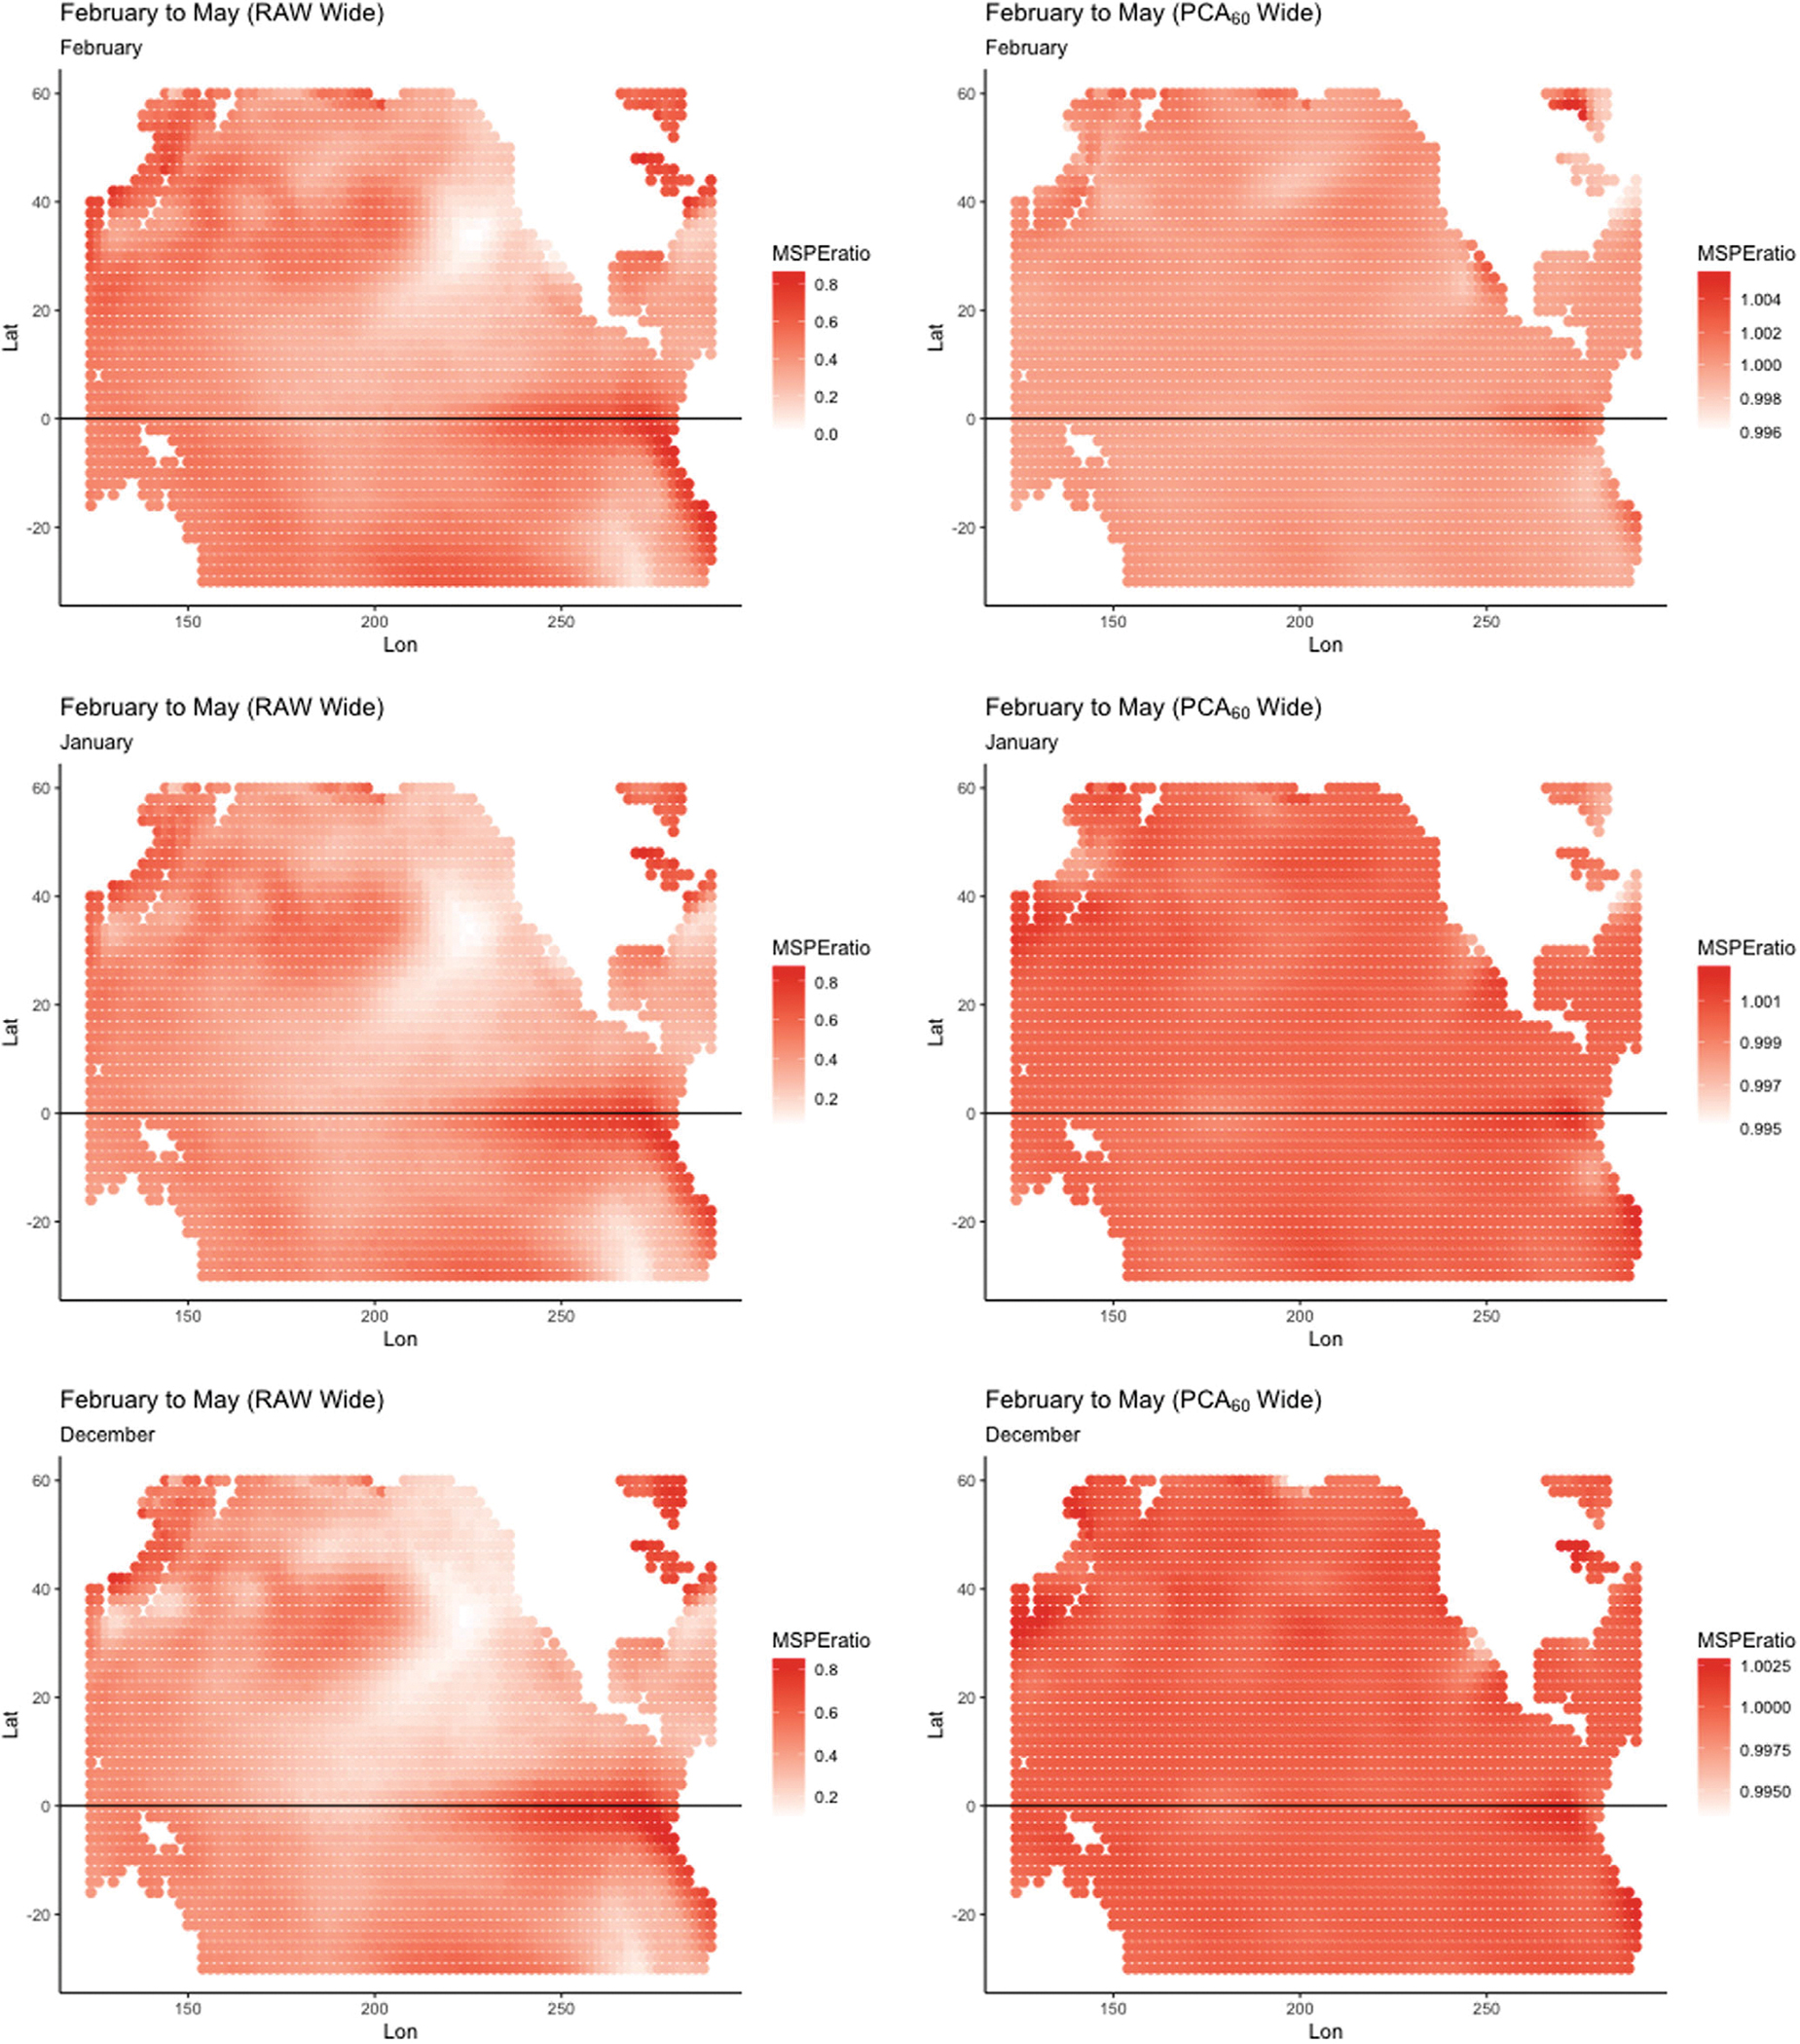
FIGURE 8.

Model reliance perturbation results for the wide approach using Wide Raw (left) and Wide PCA60 (right) for transformed SSTA data with 60 PCA components. Here, May 2014 is predicted using September 2013 to February 2014 data (note, the plots for September, October, and November are omitted). The scales on the plots vary to facilitate interpretation.
