FIGURE 3.
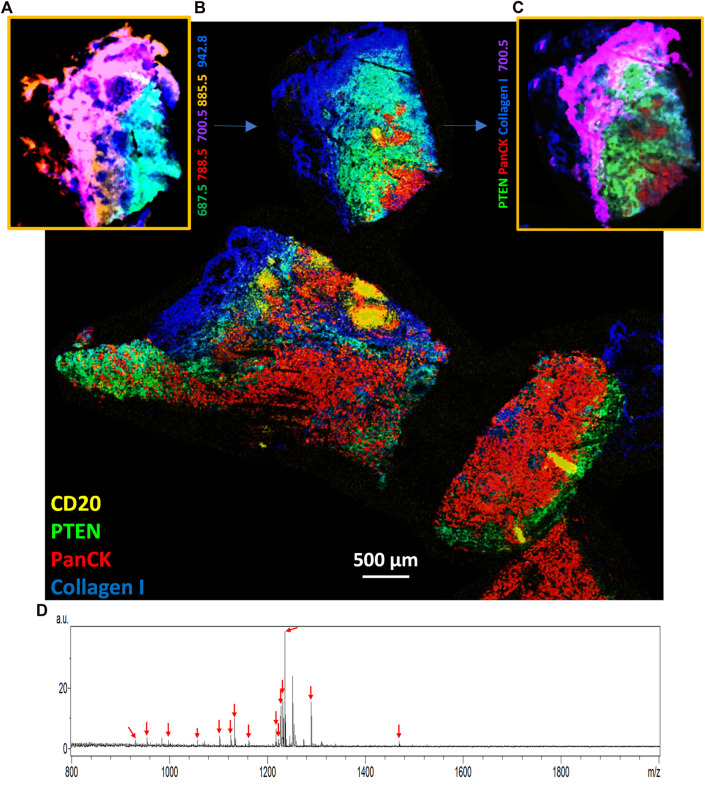
Multiomic imaging of both lipids and targeted proteins in a triple negative breast cancer tissue specimen. (A) The initial MSI run in negative ion mode showing tentatively assigned lipid molecules detected from one region of the overall tissue specimen (see color key for five tentatively assigned lipids at m/z of 687.5, 700.5, 788.5, 885.5, and 942.8). (B) After matrix removal the entire tissue specimen was stained and imaged using the MALDI-IHC protocol with 27 Miralys™ probes (Supplementary Table SII). Colors correspond to four example mass-reporters for the CD20, PTEN, panCK and collagen antibody probes (see color key in image) (see Supplementary Material, for example, images from a larger number of probes). The region corresponding to panel A, where an initial lipid MSI was measured, is indicated by the blue arrow. (C) An interactively merged image is shown of one example lipid and three of the four antibody probes for the same region of the tissue as in panel A (see color key in image for analytes shown). (D) Overall average spectrum from panel B, with arrows showing the m/z value of the 15 detected PC-MTs. Note that a peak not labeled with a red arrow appears at m/z 1251.7 is not uniquely assigned to an antibody since this mas-tag was used to label two different antibodies (α-SMA and CD45RO).

