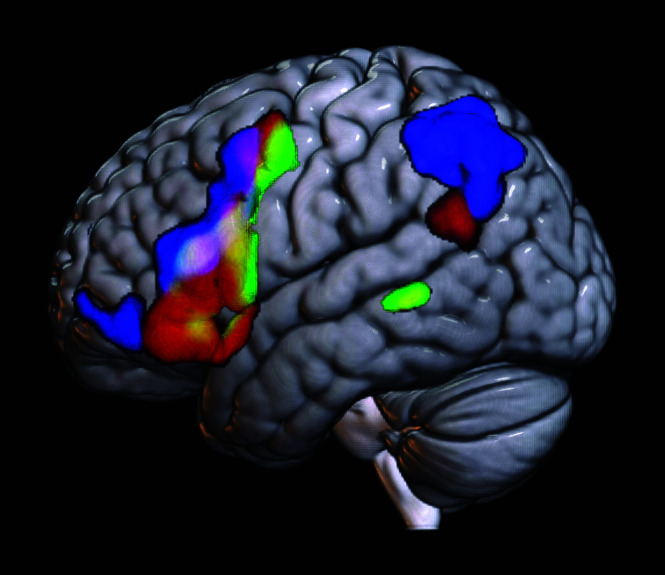
FIG 3.
Comparison of task- versus rs-fMRI averaged across subjects. Green denotes average task-fMRI activation of the language system across all subjects. Red denotes the average spatial map of the rs-fMRI component correctly selected across subjects by all reviewers. Blue represents the average spatial map of the incorrectly selected rs-fMRI component across subjects by all reviewers. Overlays are additive: Yellow denotes overlapping voxels between green (task-fMRI) and red (correct rs-fMRI component). The white area in the inferior frontal gyrus along the inferior frontal sulcus denotes overlap across task-fMRI, incorrect rs-fMRI, and correct rs-fMRI. While some overlap is noted here, which may be a function of spatial smoothing, there is a clear distinction between the correct rs-fMRI versus incorrect rs-fMRI distribution.

