
FIG 1.
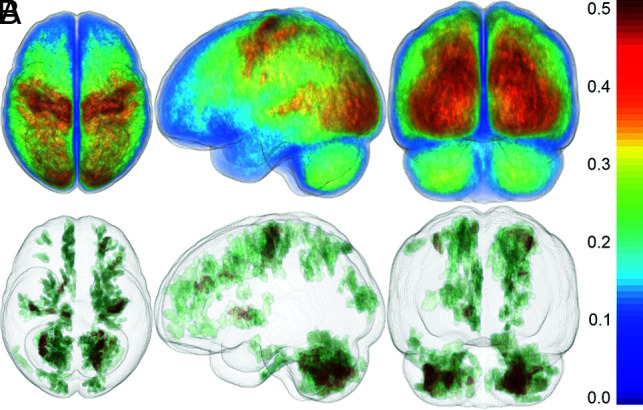
Frequency of hypoxic-ischemic brain injury in both outcome groups. Colorized 3D brain renderings show the frequency of injury (as defined by ADC < 650 × 10–6 mm2/s) for the poor-outcome group (A) and the good outcome group (B), respectively. The color bar (right) indicates the frequency of injury across the whole brain. Note that regions with <5% injury frequency are transparent to allow better visualization of more frequently injured areas.