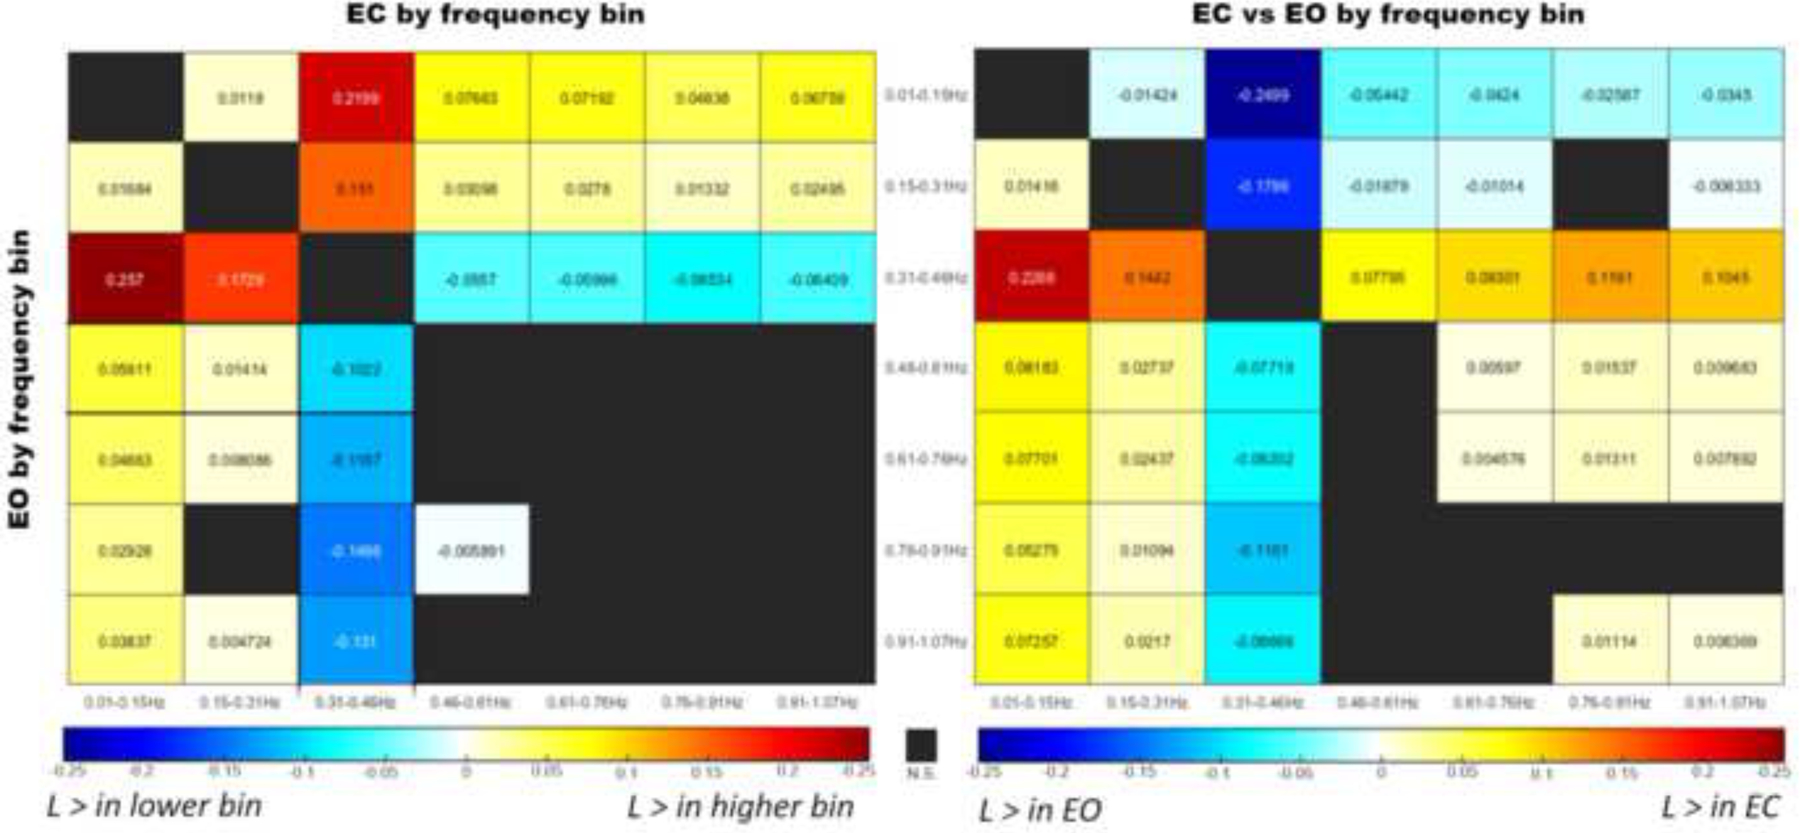
Figure 2.

Hedge’s g measure of effect size values of pairwise slope comparisons of between-task randomness () residuals across frequency bands.
(Left) Comparisons residuals with resting-state paradigm across frequency bins with EC in the upper triangular and EO on the lower triangular. Cool colors indicate a higher value in the lower frequency bin, while warm colors indicate a higher value in the higher frequency bin
(Right) EC vs EO comparisons with EC as the reference across the seven frequency bins. Warm colors indicate greater values in the EC condition, while cool colors indicate greater values in EO.
