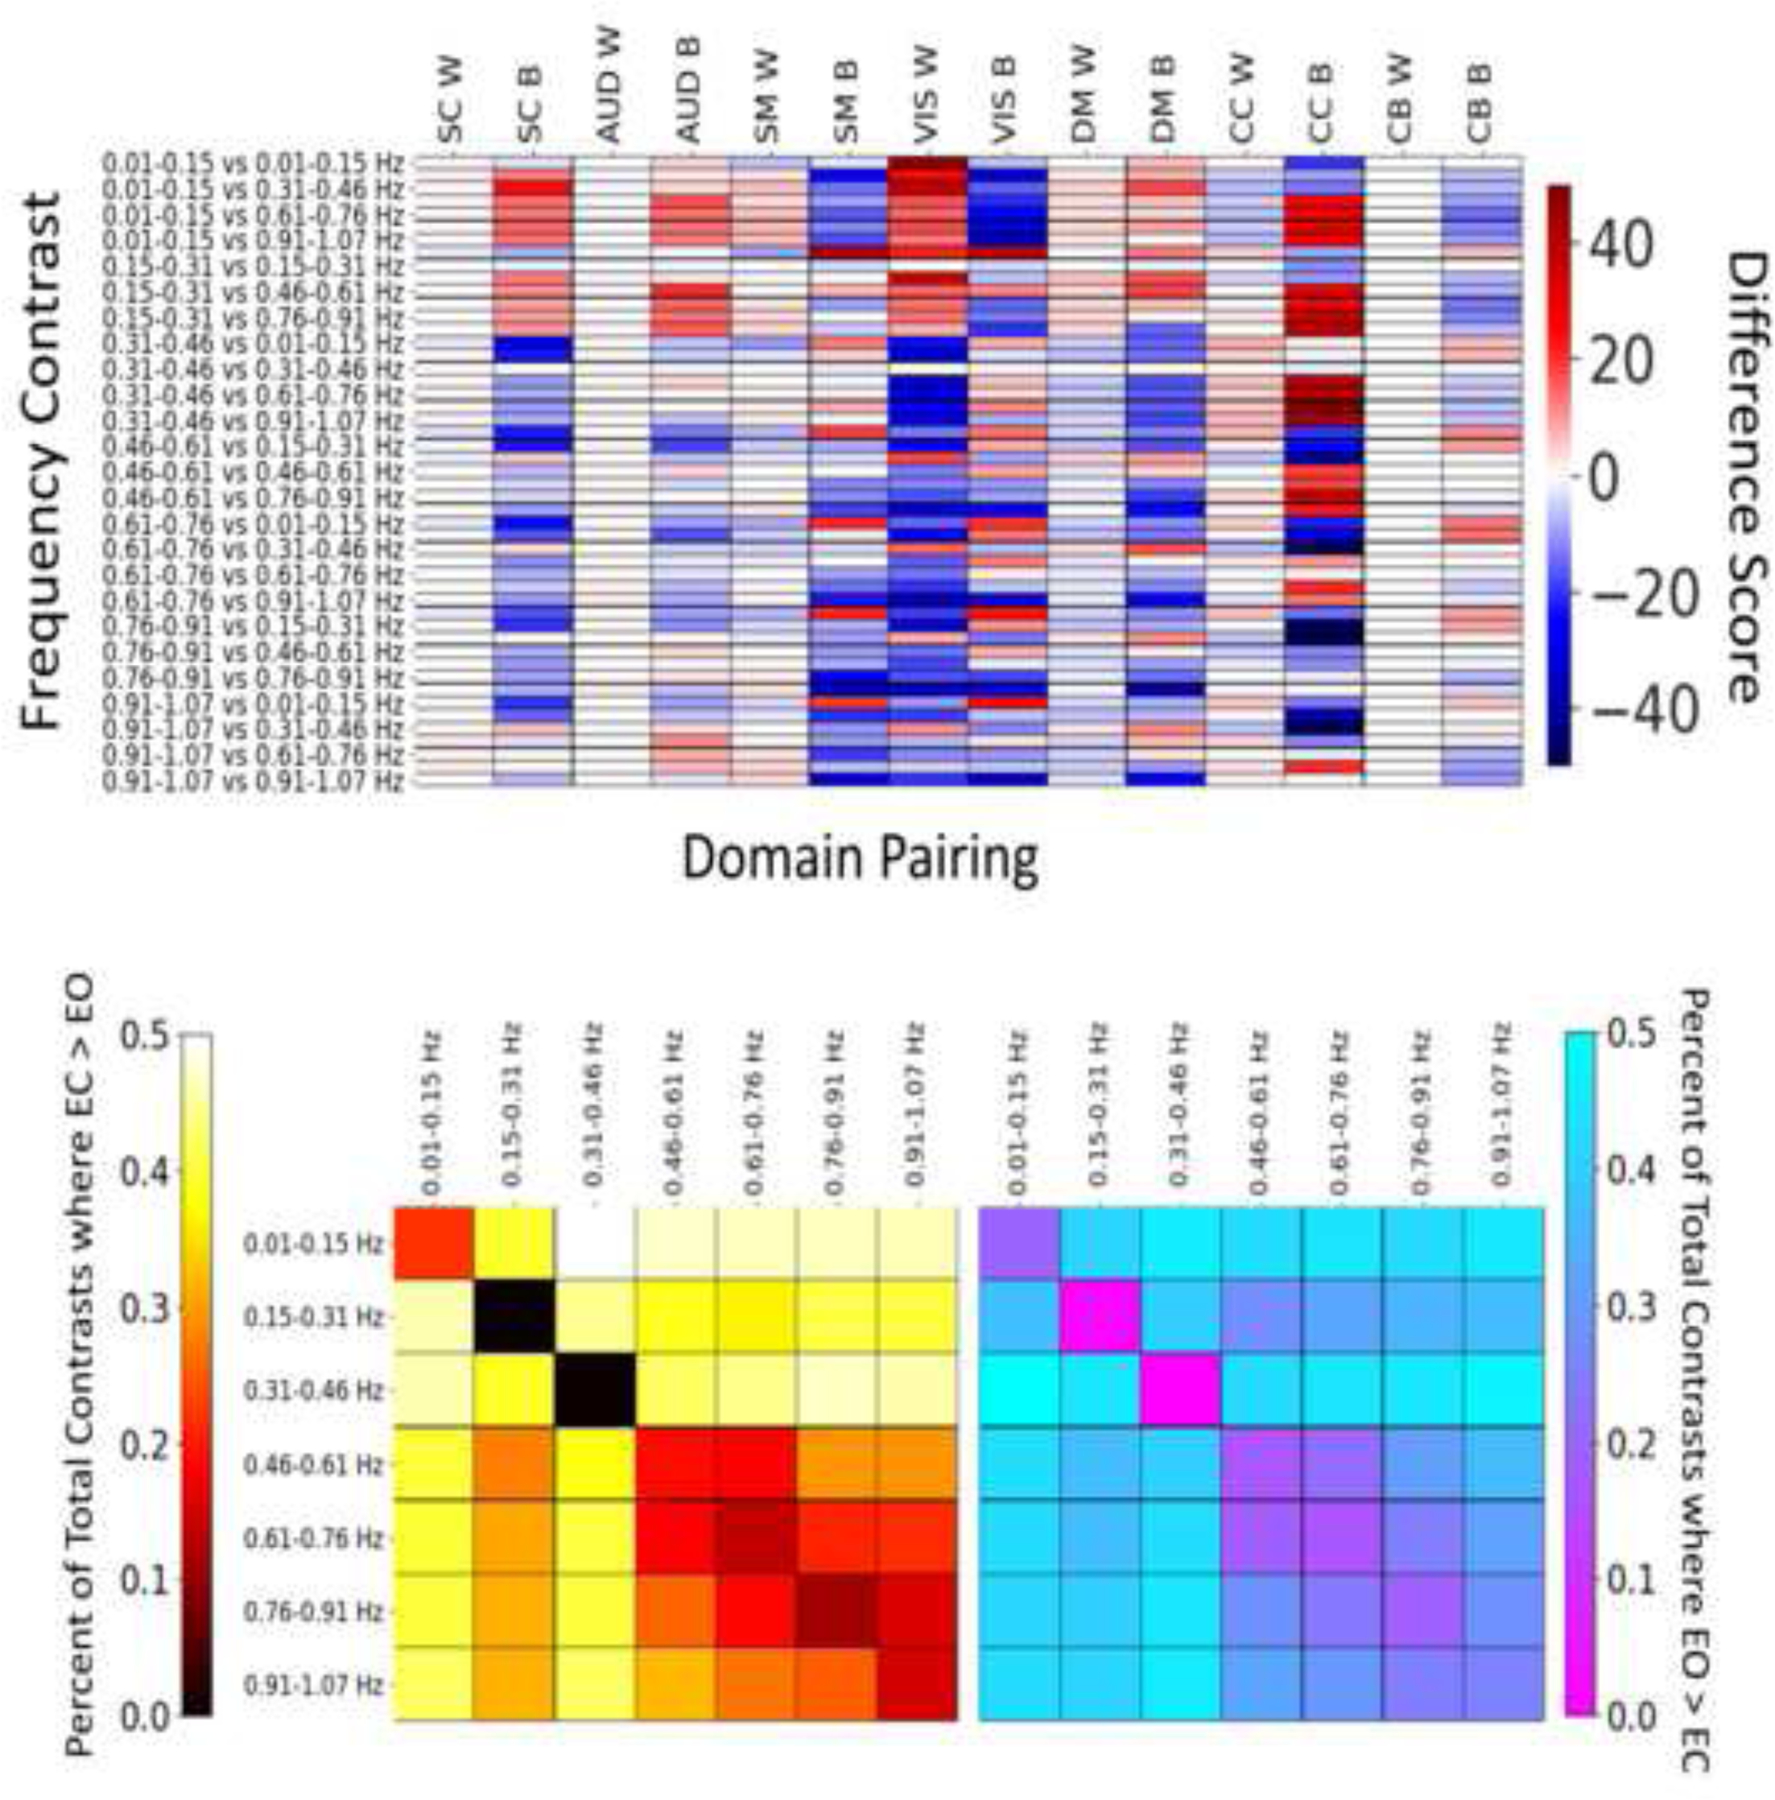
Figure 6.

(Top) Difference scores by statistically significant result counts by domain (W indicating within domain, B indicating between domain). Warm colors indicate that a contrast trends towards FC values being greater in EC, while cool colors indicate greater values in EO.
(Bottom) Quantification of the percentages of significant results by the total number of contrasts across each frequency bin comparison. The left graph with the warm colors display contrasts where effects are greater in EC compared to EO, while the figure on the right and the cool colors indicate where EO is greater to EC. Note that the scale is in raw percentages, not fractions of the total.
