
Fig. 7.
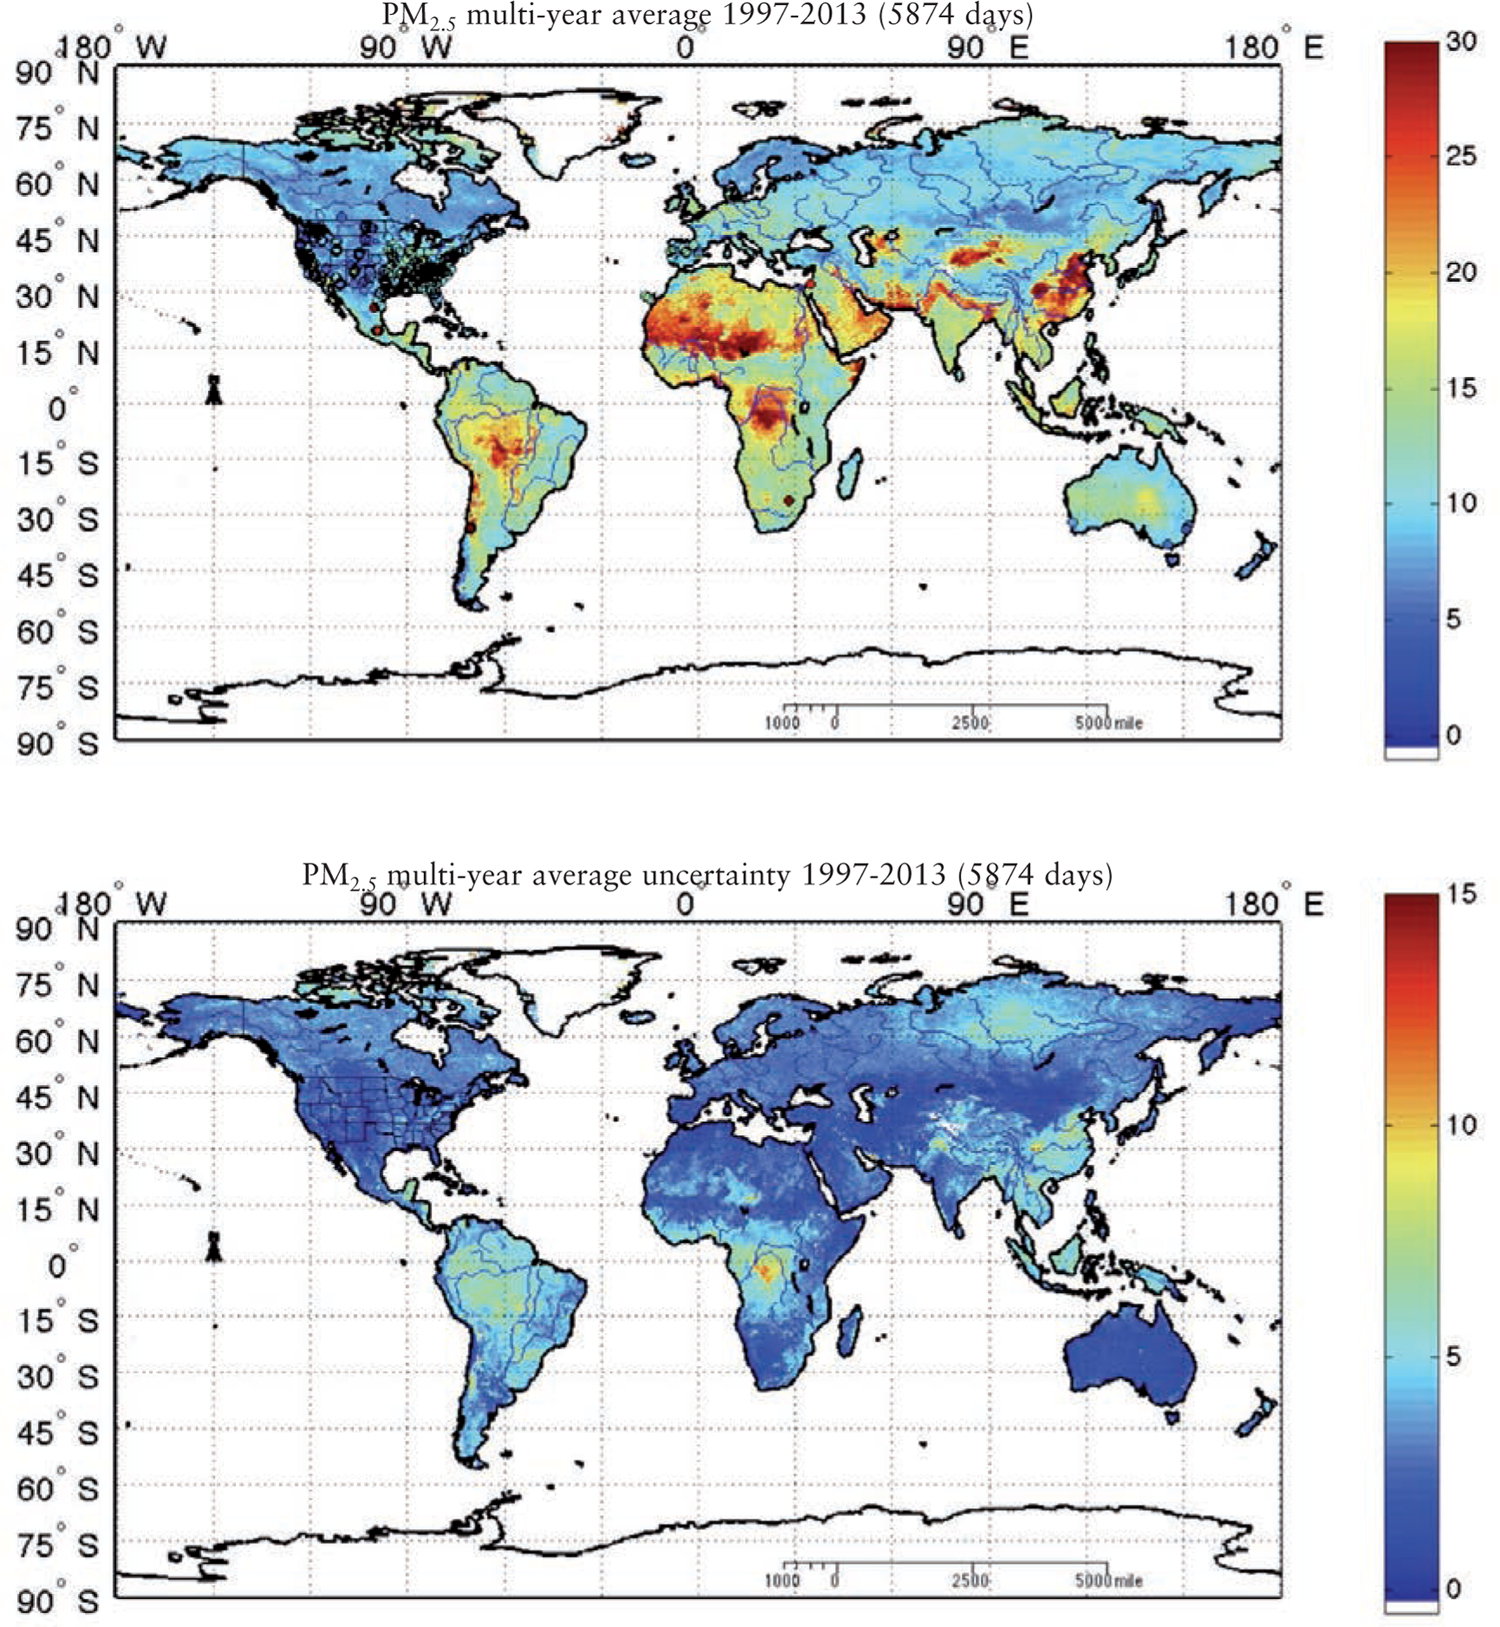
The global average of the surface PM2.5 abundance of the 5,874 daily estimates from August 1 1997 to August 31 2013 (upper panel) with the estimated uncertainty (lower panel). The surface load of PM2.5 is expressed in μg/m3 with the observations for those locations, for which we have both a machine-learning estimate of the surface PM2.5 abundance and an observation for at least one third of the 5,874, overlaid as colour-filled circles. The agreement between the machine-learning estimate and the in situ observations is well within the estimated uncertainty shown in the lower panel.