. 2023 Mar 14;66(4):1240–1251. doi: 10.1044/2022_JSLHR-22-00438

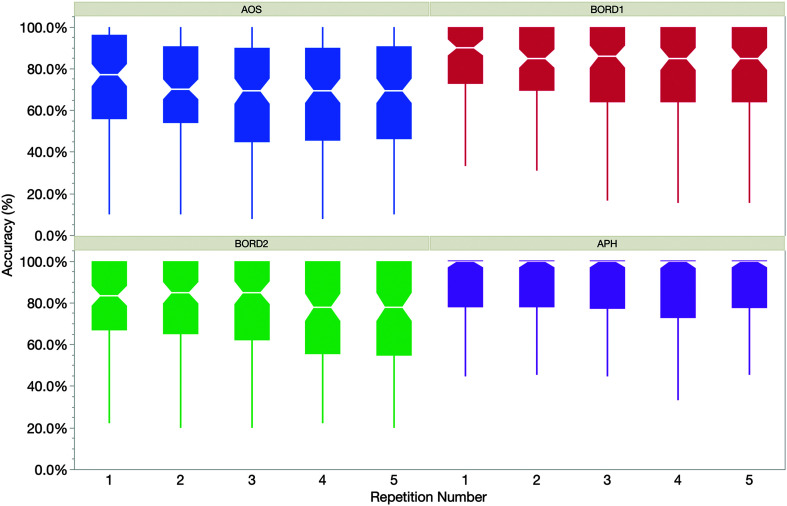
Figure 1.

4 notched box plots plotting accuracy in percentage versus the repetition number for 4 categories labeled A O S, B O R D 1, B O R D 2, and A P H. The description organizes the data as follows: Repetition number, Median, Notch range, first quartile, third quartile, minimum value, and maximum value. The data for the plot titled A O S is as follows. 1, 78, 70 to 84, 55, 95, 10, 100. 2, 70, 65 to 75, 55, 90, 10, 100. 3, 70, 65 to 75, 45, 90, 10, 100. 4, 70, 65 to 75, 45, 90, 10, 100. 5, 70, 65 to 75, 45, 90, 10, 100. The plot titled B O R D 1 does not have a maximum value and its data is as follows. 1, 90, 85 to 95, 70, 100, 30. 2, 85, 75 to 90, 70, 100, 30. 3, 85, 75 to 90, 60, 100, 20. 4, 85, 75 to 90, 60, 100, 20. 5, 85, 75 to 90, 60, 100, 20. The plot titled B O R D 2 does not have a maximum value and its data is as follows. 1, 85, 75 to 90, 67, 100, 23. 2, 85, 80 to 90, 65, 100, 20. 3, 85, 75 to 90, 60, 100, 20. 4, 75, 70 to 85, 55, 100, 25. 5, 75, 70 to 85, 55, 100, 20. In the plot titled A P H, the boxes do not have the tapering portion above the notch. The following description organizes the data as median, first quartile, minimum value, and maximum value. 1, 100, 50, 100. 2, 100, 80, 50, 100. 3, 100, 80, 50, 100. 4, 100, 70, 35, 100. 5, 100, 85, 50, 100. All values are estimated.

Median phonemic accuracy by repetition trial for the four participant groups. Interquartile range is displayed by the boxes; median value is notched for each box. Whiskers represent minimum and maximum values, excluding outliers. AOS = profile most consistent with apraxia of speech; APH = profile most consistent with aphasia without AOS; BORD1 and BORD 2 = borderline or inconclusive profile.