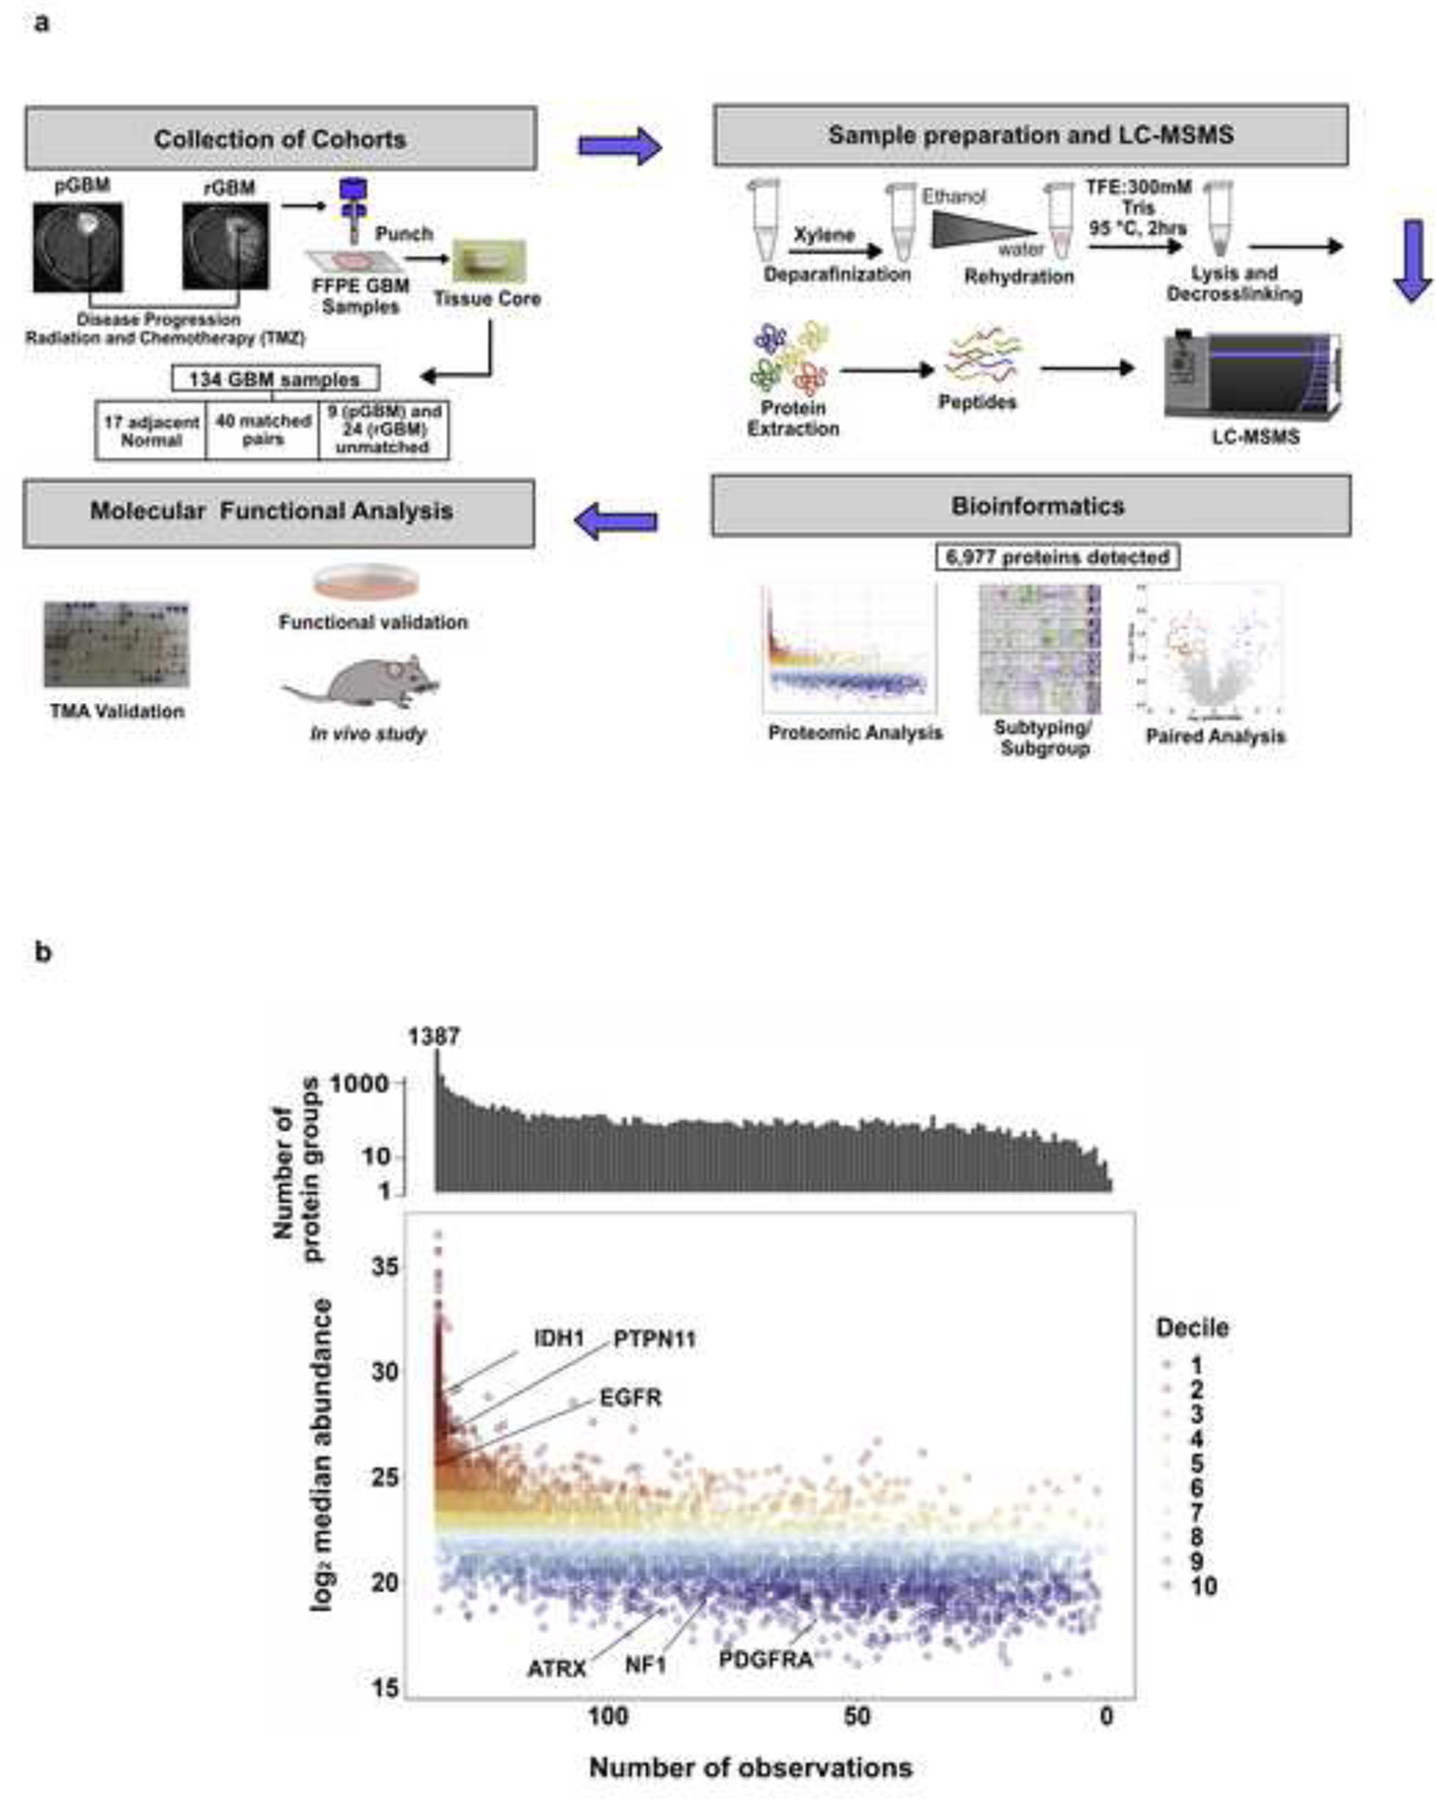
Fig. 1: pGBM and rGBM have distinct genomic and protein landscapes.

a, Schematic representation of sample collection and preparation, MS proteomics, target identification and functional analysis workflow. b, Distribution of protein quantitation measured as median intensity by the number of samples they are detected in. Bar plot on top represents the total counts of proteins quantified by the number of samples they are present in. Missing values were omitted when calculating the median.
