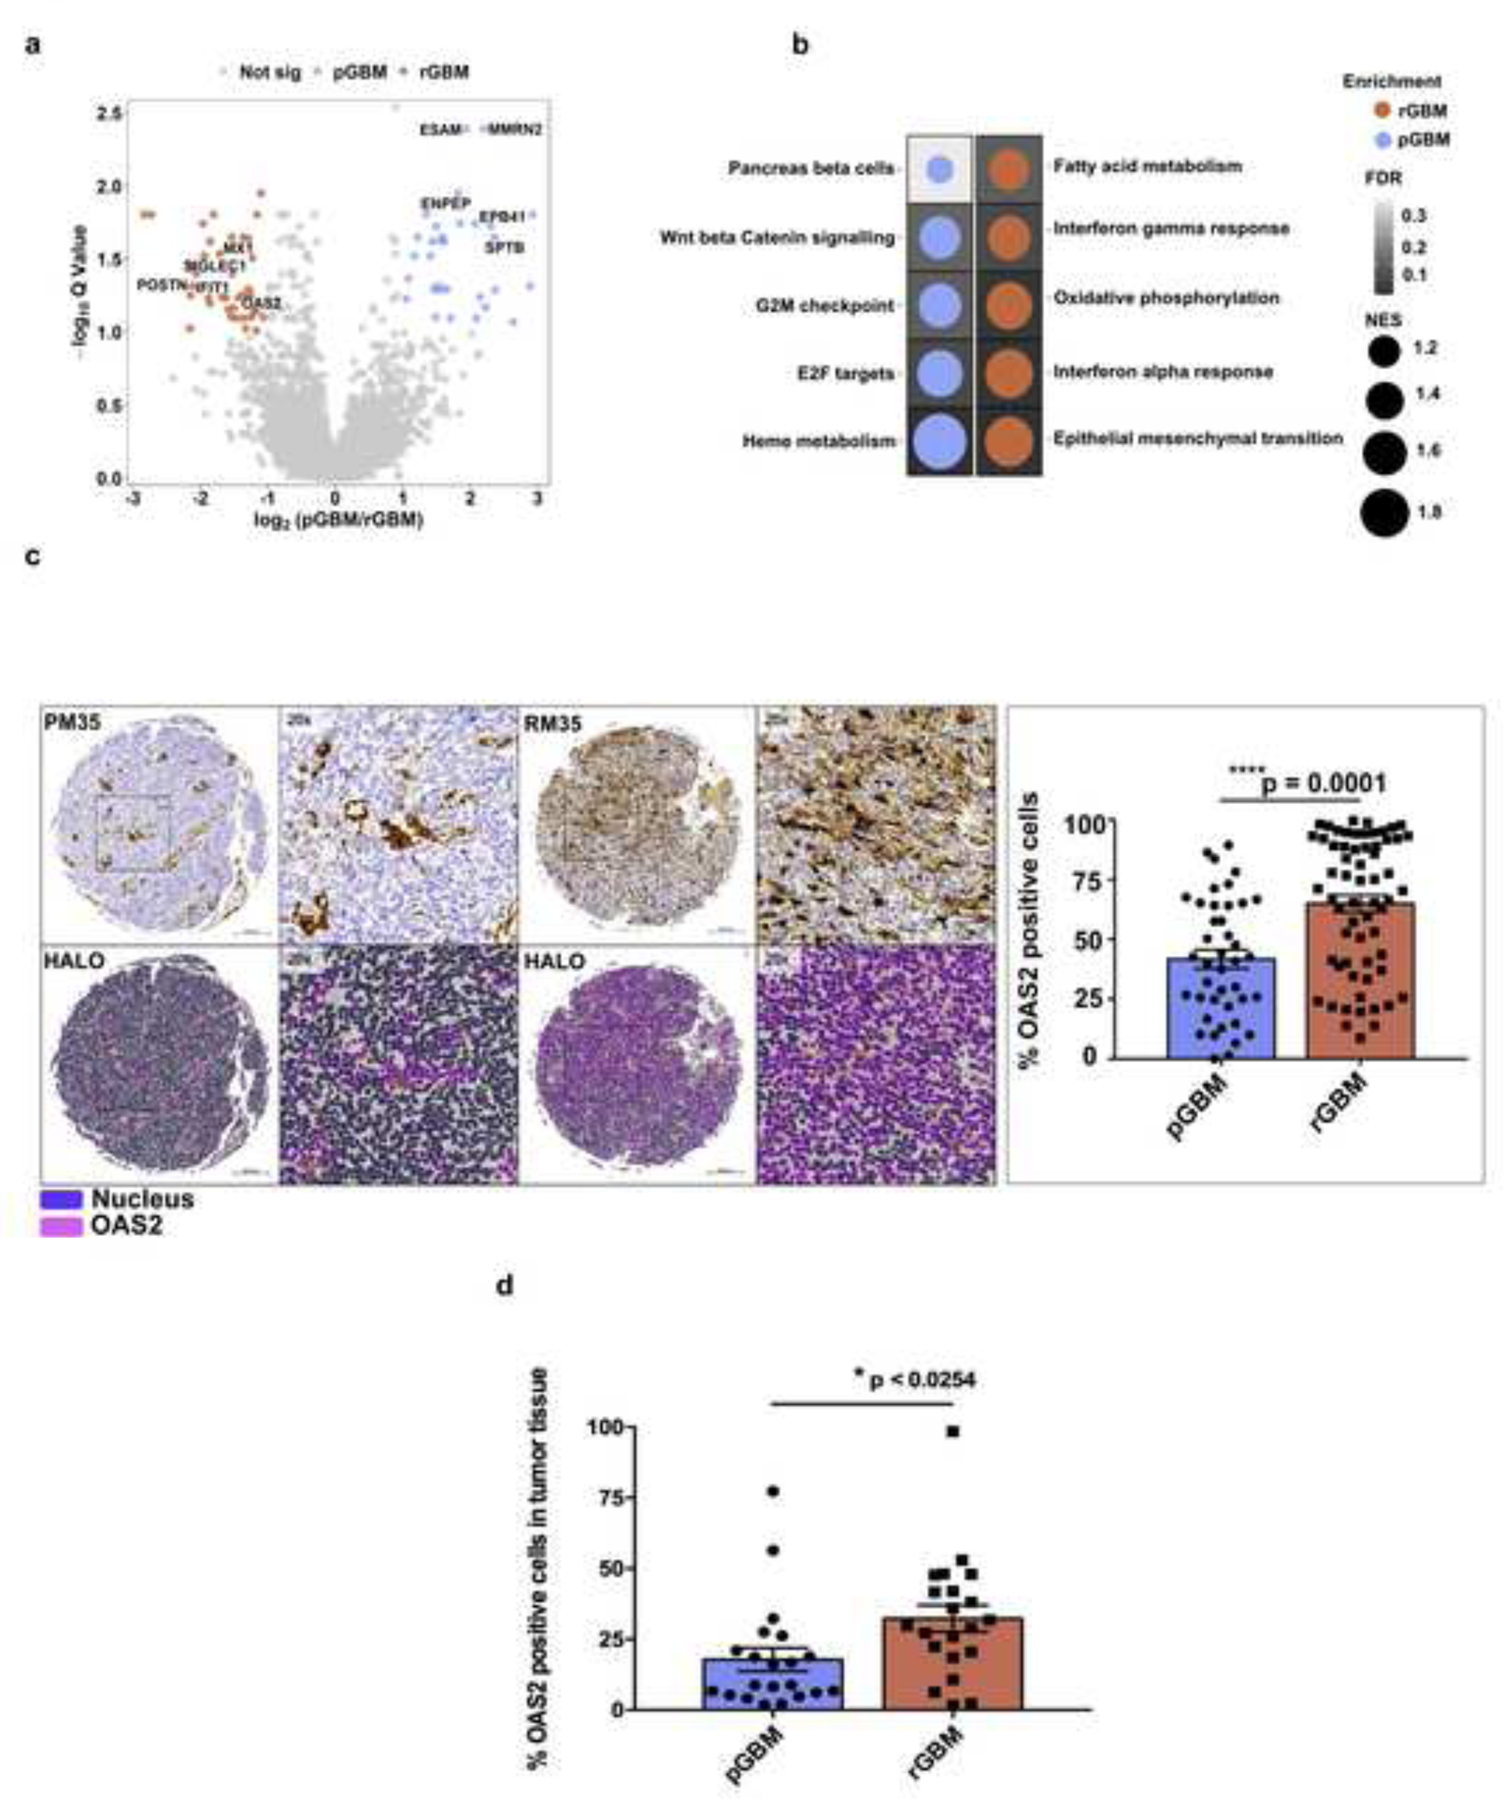
Fig. 3: Differential expression analysis between pGBM-rGBM matched pairs introduces OAS2, an essential gene for rGBM with significant upregulation at the recurrent stage.

a, Volcano plot depicting differential abundance analysis between pGBM and rGBM in matched sample pairs. Proteins significantly enriched in rGBM patients are indicated in red, while proteins enriched in pGBM are indicated in blue (Q value < 0.1; log2 fold change > 1). b, Gene set enrichment analysis (GSEA) showing the top significantly enriched pathways in pGBM vs. rGBM. The dot plot shows the normalized enrichment scores (NES) with the background color gradient representing the Q values. c, Immunohistochemical analysis of OAS2 on TMA consisting of both matched and unmatched pGBM-rGBM samples indicated a significantly higher level of OAS2 at the recurrent stage. (The representative image shows pGBM (PM35)-rGBM (RM35) matched samples) (Scale bar: 200 um, P value: *** 0.0002, **** < 0.0001). d, Overexpression of OAS2 in rGBM was confirmed by immunohistochemical analysis on a TMA construct consisting of an independent cohort of 20 pGBM-rGBM matched samples.
