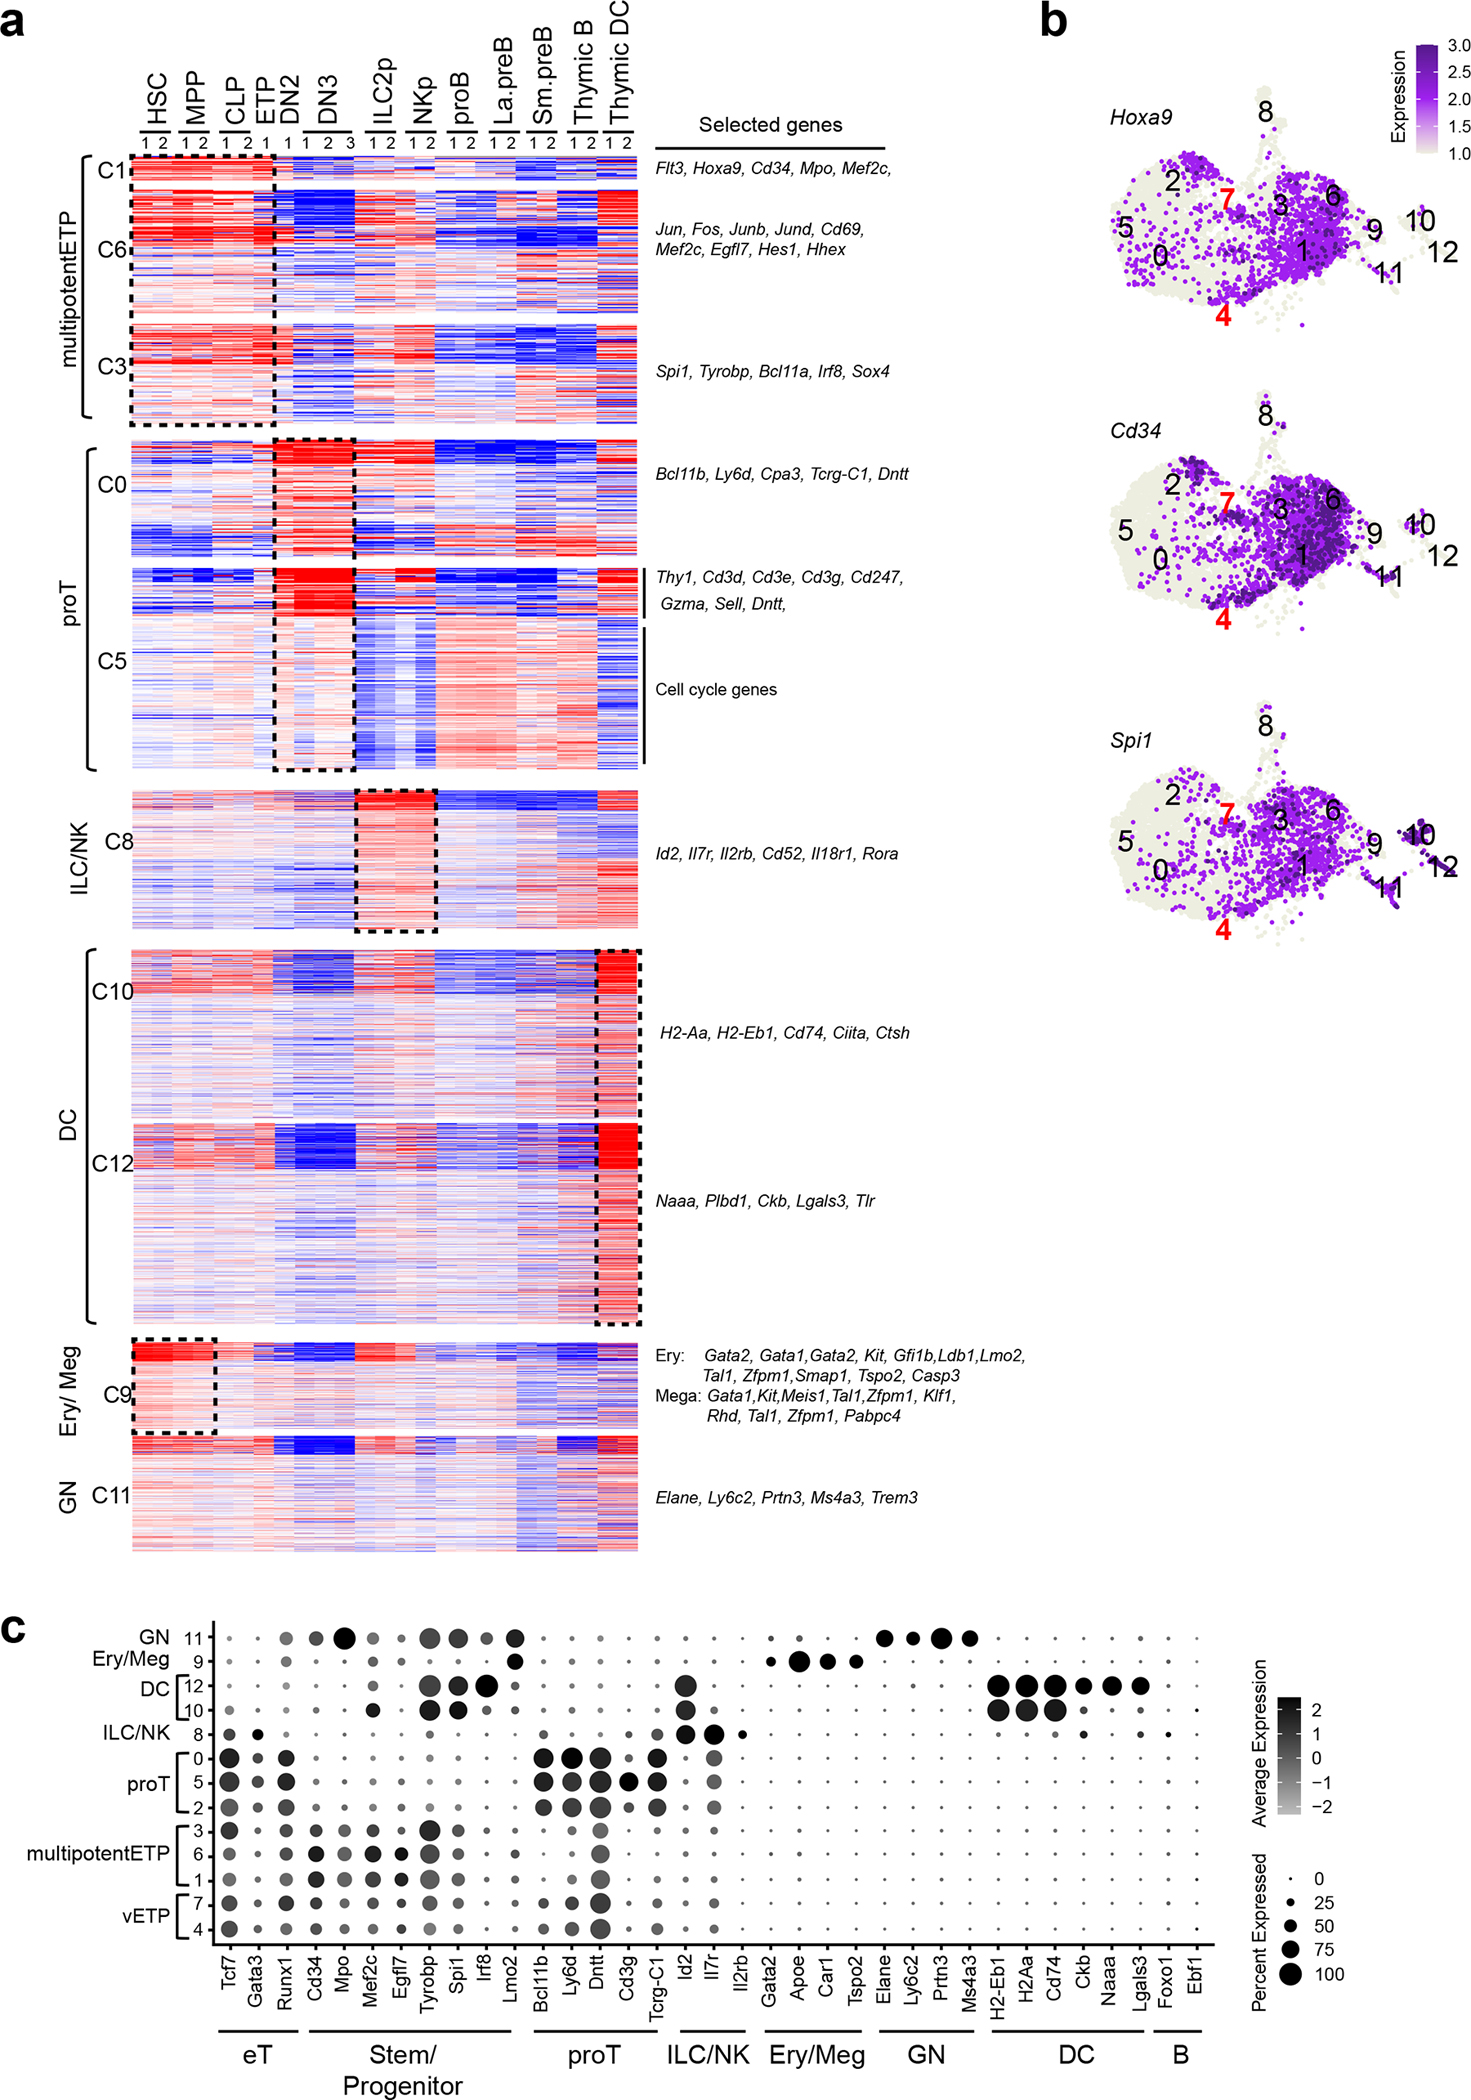
Extended Data Fig. 5. Deducing lineage affiliation of cells in ETP sub-clusters (replicate 1).

(a) Previously established gene expression data sets from HSC, early lineage progenitors and thymic DC were used to define the cell type affiliation of ETP cluster-defining gene markers. The list of markers is summarized in Supplementary Table 1. (b) Expression of Hoxa9, Cd34, and Spi1 in the UMAP defined clusters are shown. (c) Expression of genes that define ETP subsets and downstream stages of T cell differentiation as well as genes representative of ILC/NK, GN, Ery/Meg, DC, and B cell differentiation are shown. Color intensity is proportional to the average gene expression across cells in the indicated clusters. The size of circles is proportional to the percent of cells expressing the indicated genes.
Two replicates of HSC, MPP, CLP, ILC2p, NKp, and thymic DC were obtained from published datasets (GEO: GSE77695, GSE183056). ETP, DN2, DN3, proB, La.preB, Sm.preB, and thymic B data sets were generated in this study (as described in Fig. 1 and Fig. 2).
