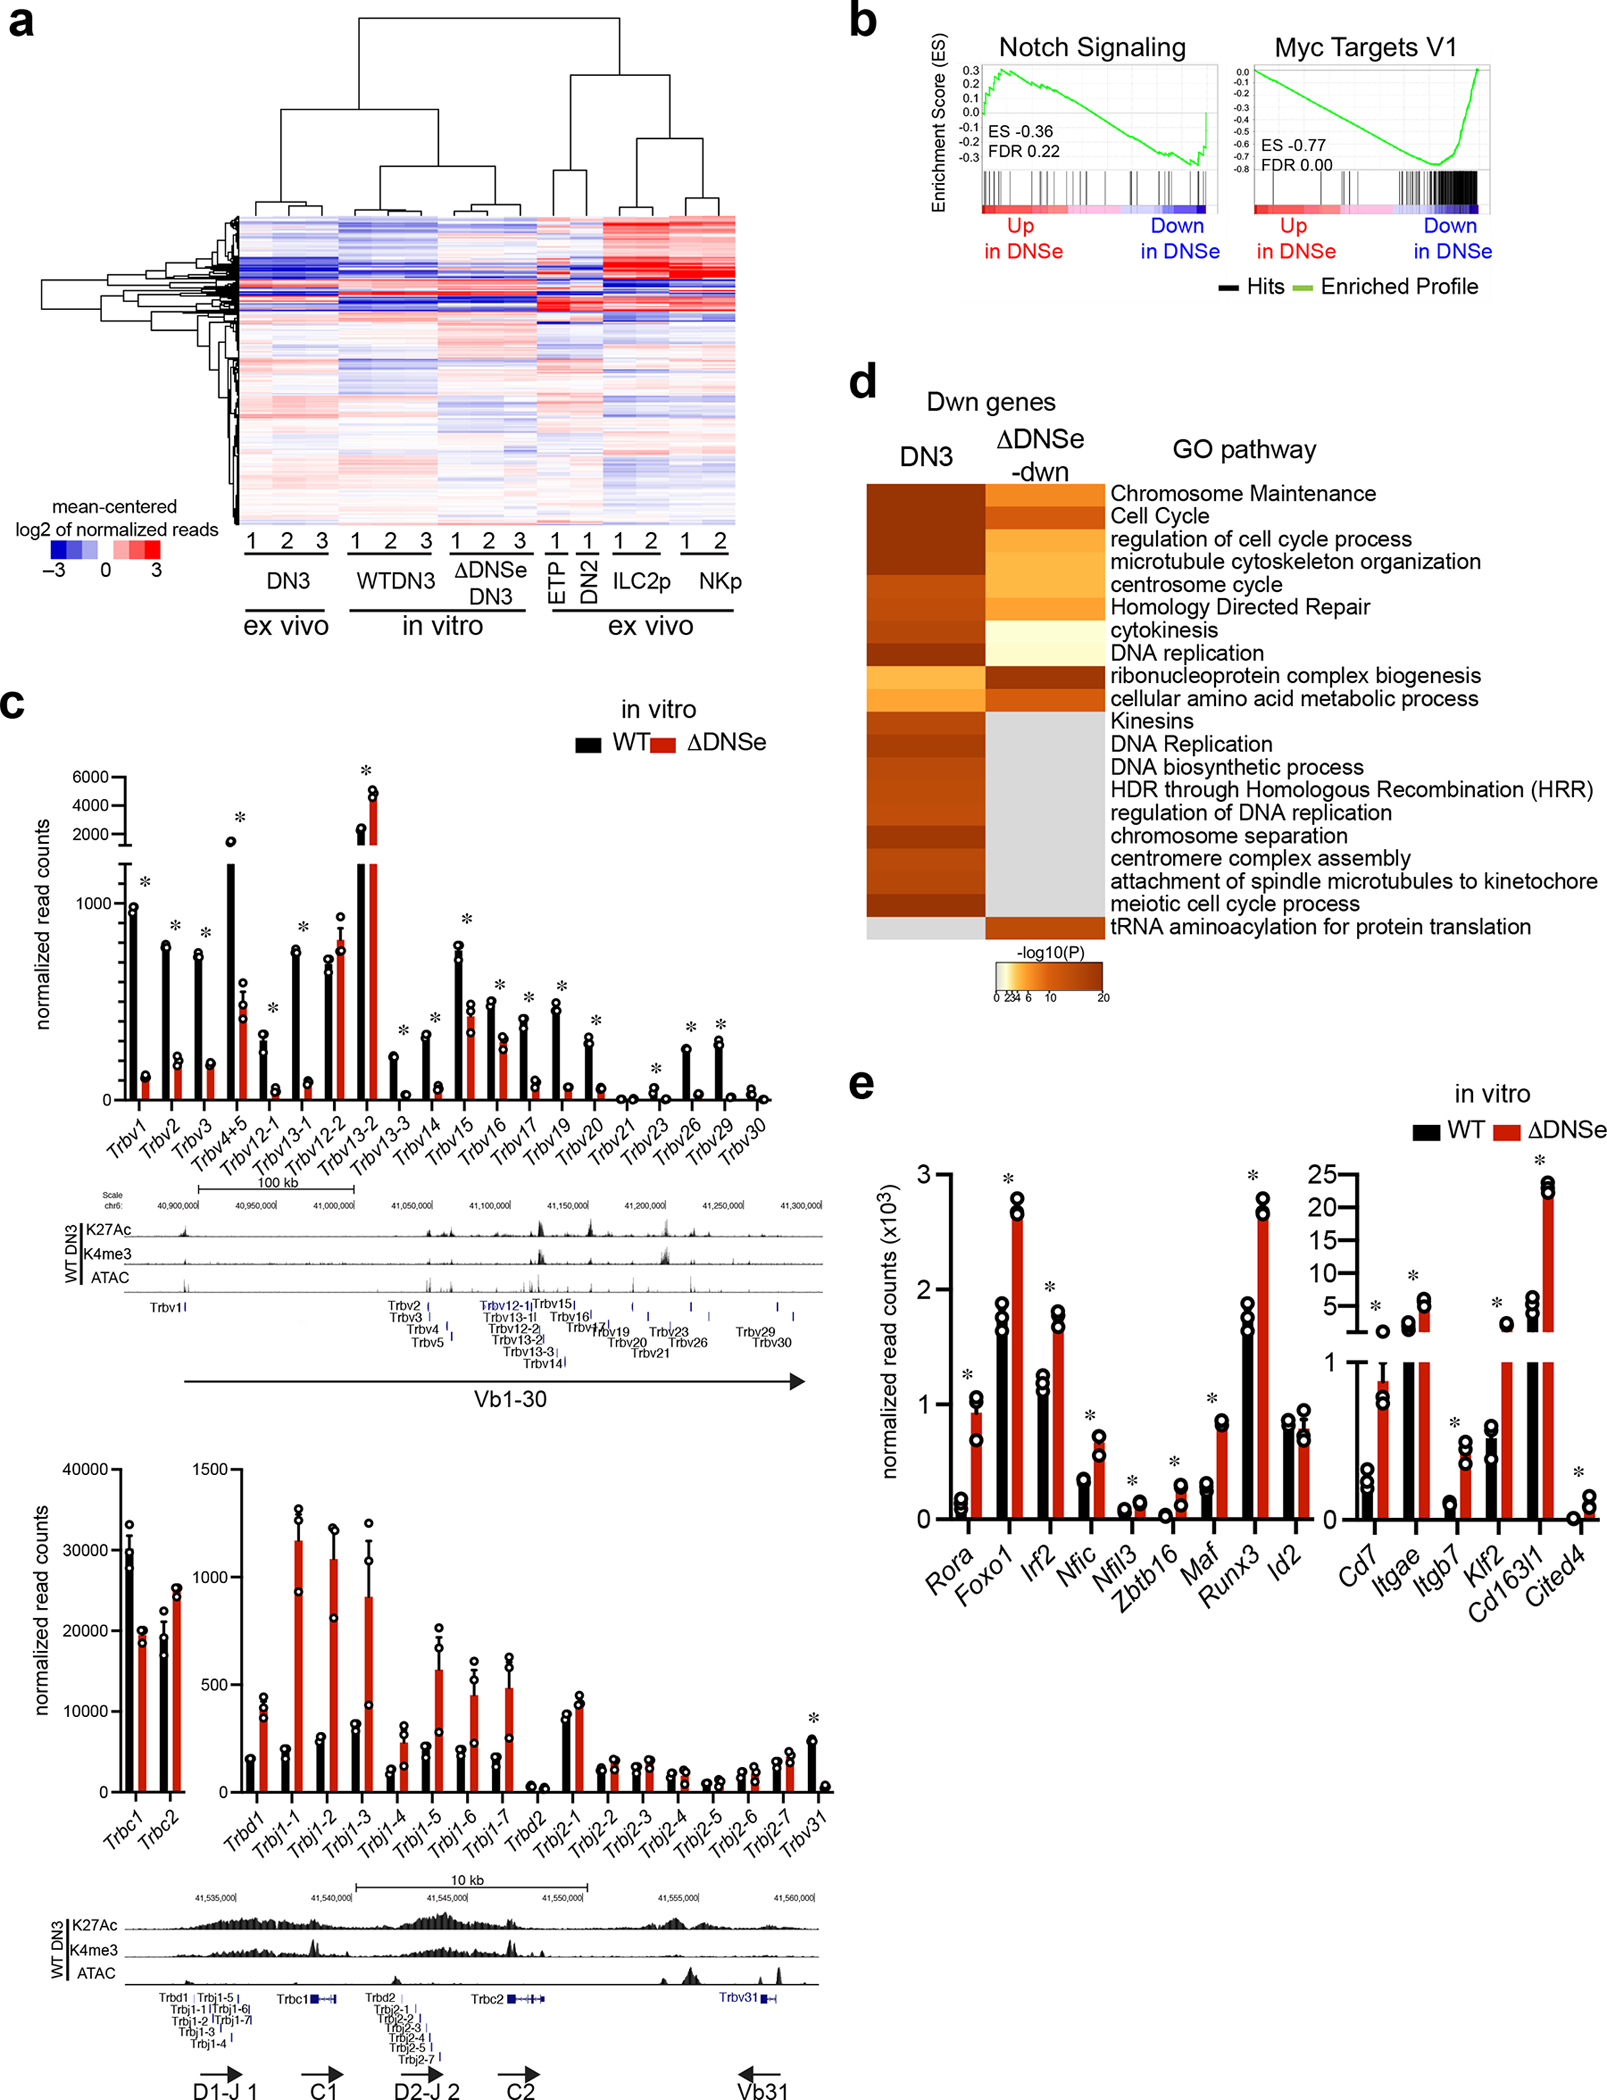
Extended Data Fig. 7. Gene expression profiling for cultured WT and ΔDNSe DN3 cells.

(a) Hierarchical clustering of genes expressed in cultured DN3, ex vivo T cell progenitors and innate lymphoid progenitors is shown. Genes with > 50 reads in at least one data set were clustered. (b) Enrichment of ΔDNSe deregulated genes in the Notch Signaling (Hallmark Notch Signaling) and Myc (Hallmark Myc target V1) pathways are shown by GSEA. Genes ranked from most upregulated (left end) to most downregulated (right end) in ΔDNSe relative to WT DN3 cells are plotted on the X axis. Enrichment profiles of genes are plotted on Y axis and calculated enrichment score (ES) and FDR are shown. (c) The full expression panel for Trbv, Trbc, Trbd and Trbj genes in cultured DN3 cells as determined by RNAseq is shown (mean +/− SEM. * adj. p <0.01 Expression data for Trbv genes is also shown in Fig. 6e. Reduction in expression of genes encoding Vβ region (Trbv) were detected in ΔDNSe relative to WT DN3 with the exception of Trbv12-2 and Trbv13-2. Expression of genes encoding Cβ, Dβ and Jβ regions (Trbc, Trbd, and Trbj) were similar or even higher in ΔDNSe DN3, suggesting that ΔDNSe DN3 have already undergone D-J rearrangement. (d) Heatmaps based on significance of functional pathway enrichment (−log10(pval)) are shown for down-regulated genes classified as a DN3 and ΔDNSe-dwn signatures as shown in Fig. 6c. (e) Expression of genes related to innate lymphoid lineages in cultured DN3 cells as determined by RNAseq is shown (mean +/− SEM). * adj. p <0.01
Data for cultured DN3 cells were generated from three independent experimental groups for each genotype. Data for ex vivo ETP, DN2 and DN3 were generated in this study as in Fig. 1. Data for ILC2p and NKp were obtained from published datasets (GEO: GSE77695) as in Fig. 6 and Extended Data Fig. 5.
