
Fig. 4. ETP multipotency requires the Notch1 DNS enhancer.
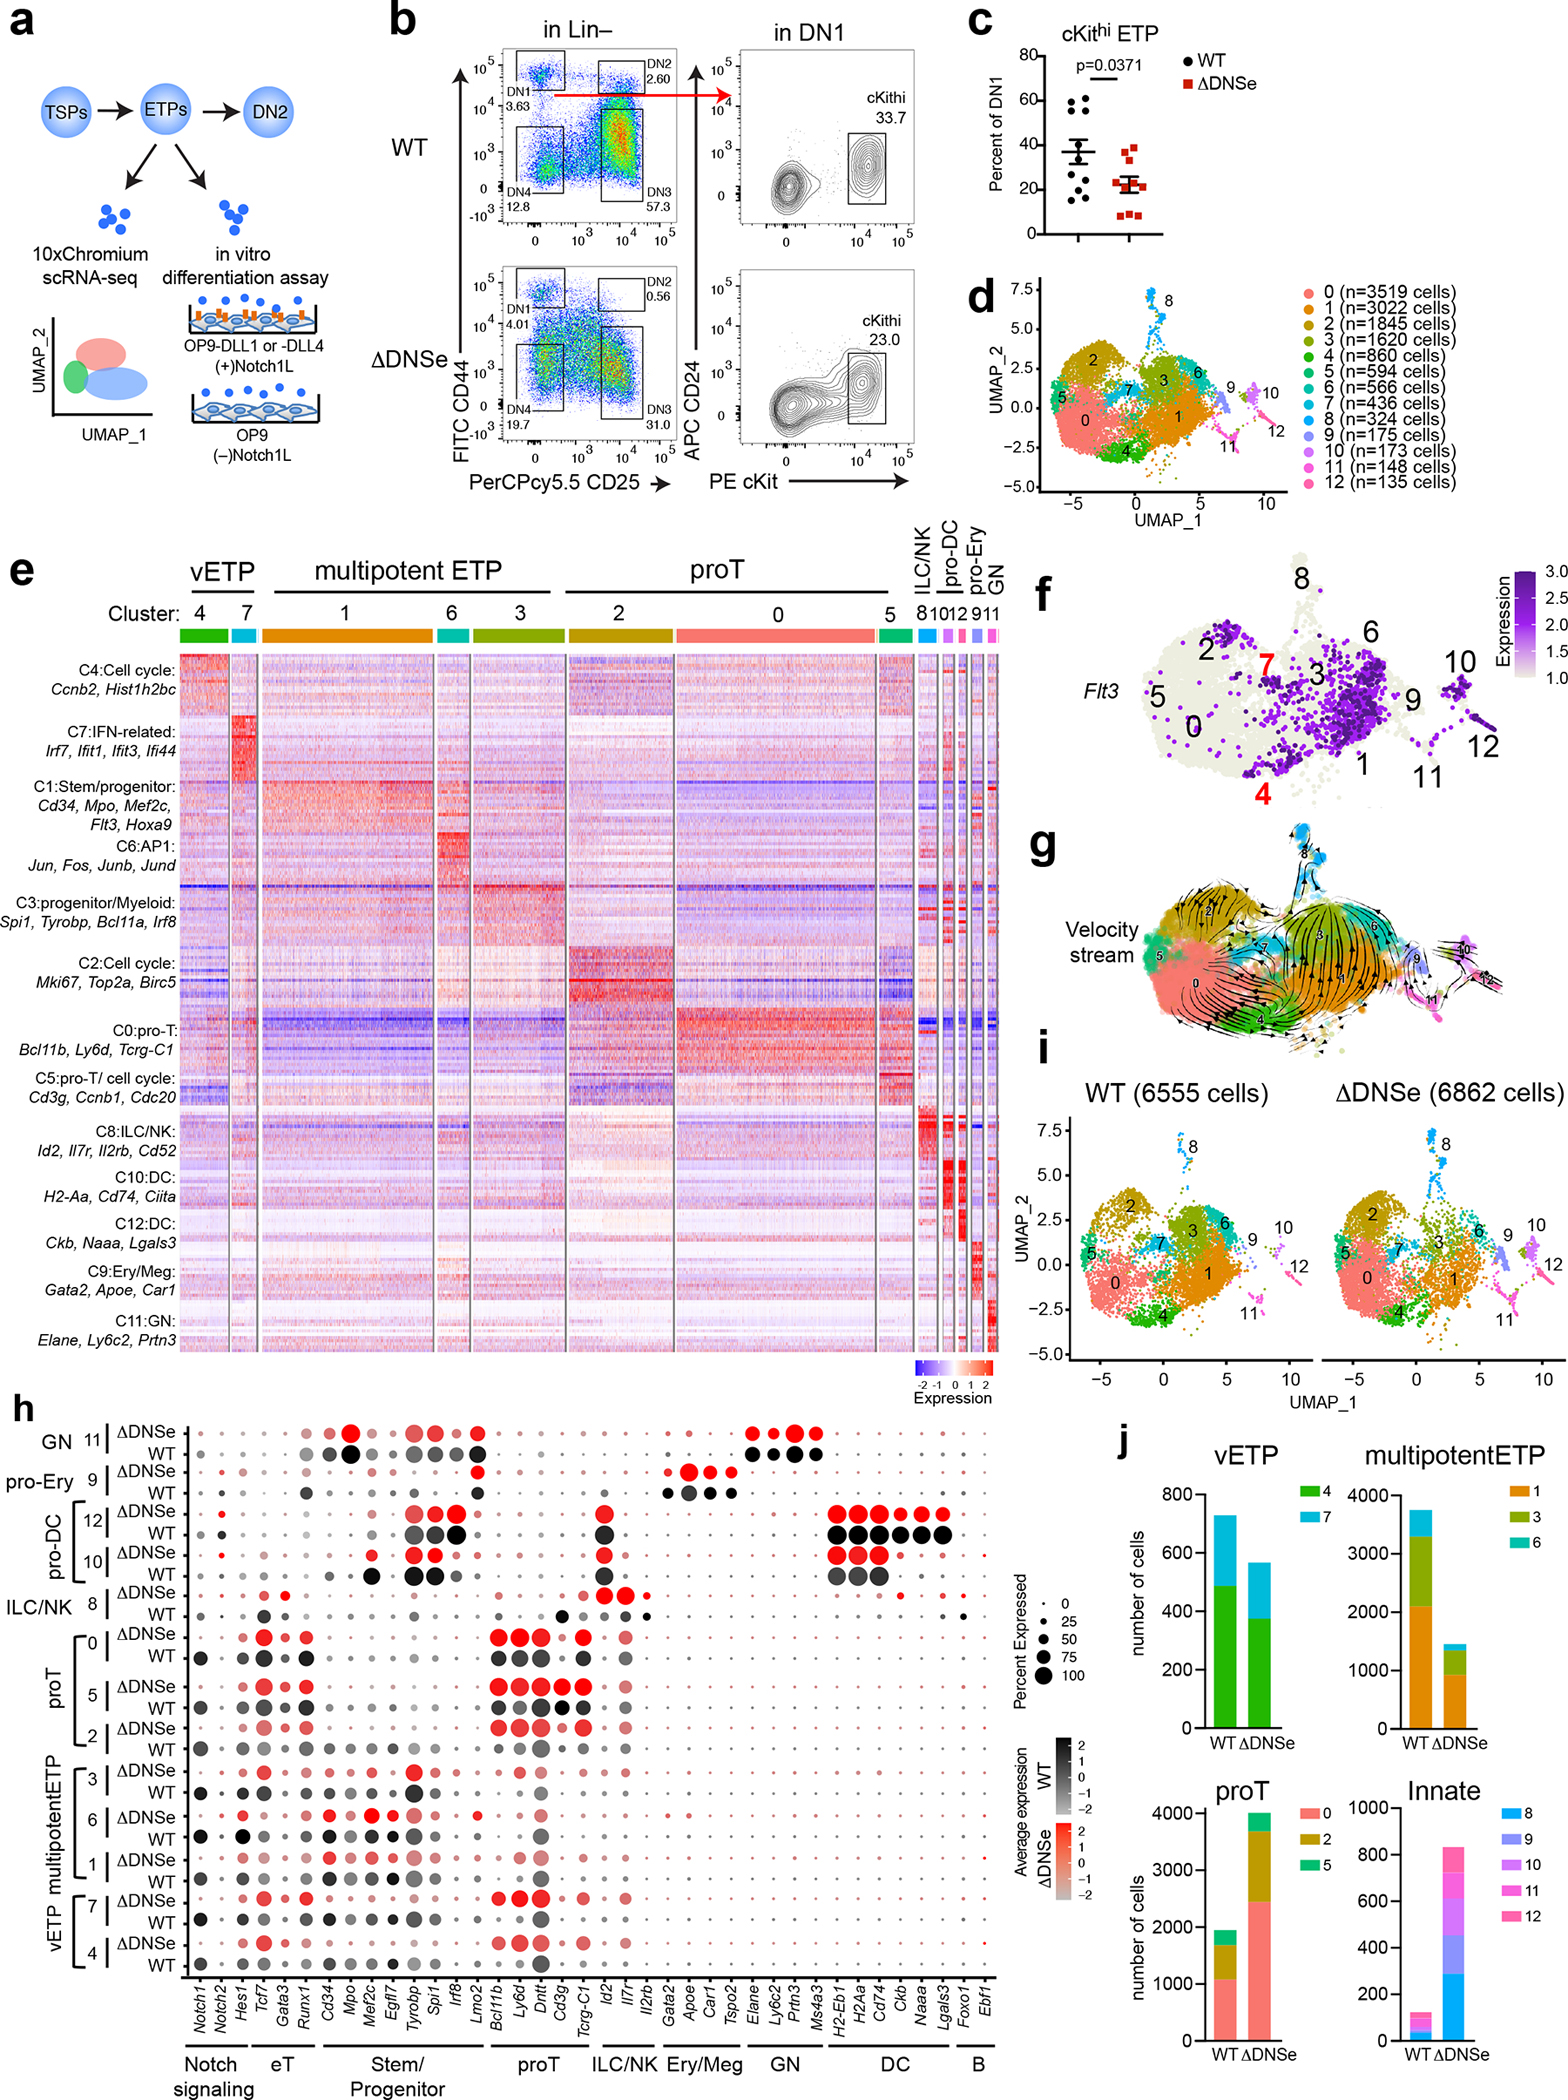
(a) Experimental strategy to test heterogeneity and lineage differentiation potential of ETPs using scRNA-seq and in vitro differentiation assays. (b) ETP FACS analysis is shown in WT and ΔDNSe mice (28–35 days old). ETPs (ckithi) were identified by differential expression of cKit, and CD24 in Lin(−)CD44+CD25−DN1 cells. (c) Relative numbers of cKithi ETPs in WT and ΔDNSe DN1 cells are shown. Average and SEM are provided for each population with unpaired t-test (two-tailed) used for statistical analysis. (d) Integrated analysis and UMAP visualization of WT ETPs (6555 cells) and ΔDNSe ETPs (6862 cells), is shown in 13 colored sub-clusters. Absolute cell number per cluster is shown in parenthesis. (e) Heatmap of the top 20 enriched genes in each sub-cluster ordered by approximate developmental progression based on gene expression and connectivity in the UMAP display. (f) Flt3 expression is shown in the UMAP defined clusters. (g) RNA velocity trajectories are shown in the UMAP space for the combined WT and ΔDNSe ETP single cell data sets. The vector calculation was performed without the 1248 cell-cycle-associated genes that belonged to either GO term: GO:0022402 or Reactome Pathway ID: R-MMU-1640170. (h) Expression of genes that define ETP subsets and downstream stages of T cell differentiation as well as genes representative of innate lymphoid/natural killer (ILC/NK), granulocyte (GN), erythroid/megakaryocyte (Ery/Meg), dendritic cell (DC), and B cell differentiation are shown separately for WT and ΔDNSe. Color intensity is proportional to the average gene expression across cells in respective clusters. The size of circles is proportional to the percent of cells expressing the indicated genes. (i) Independent visualization of WT and ΔDNSe ETPs by UMAP reveals a differential impact of the DNSe mutation on ETP subclusters 0–12. (j) The effect of the DNSe mutation on ETP subcluster composition is shown by bar graph format.
Data shown in (b) were representative FACS profiles from 9 independent experiments with WT (N=11) and ΔDNSe (N=10) samples pooled from at least 3 biological replicates as in (c).