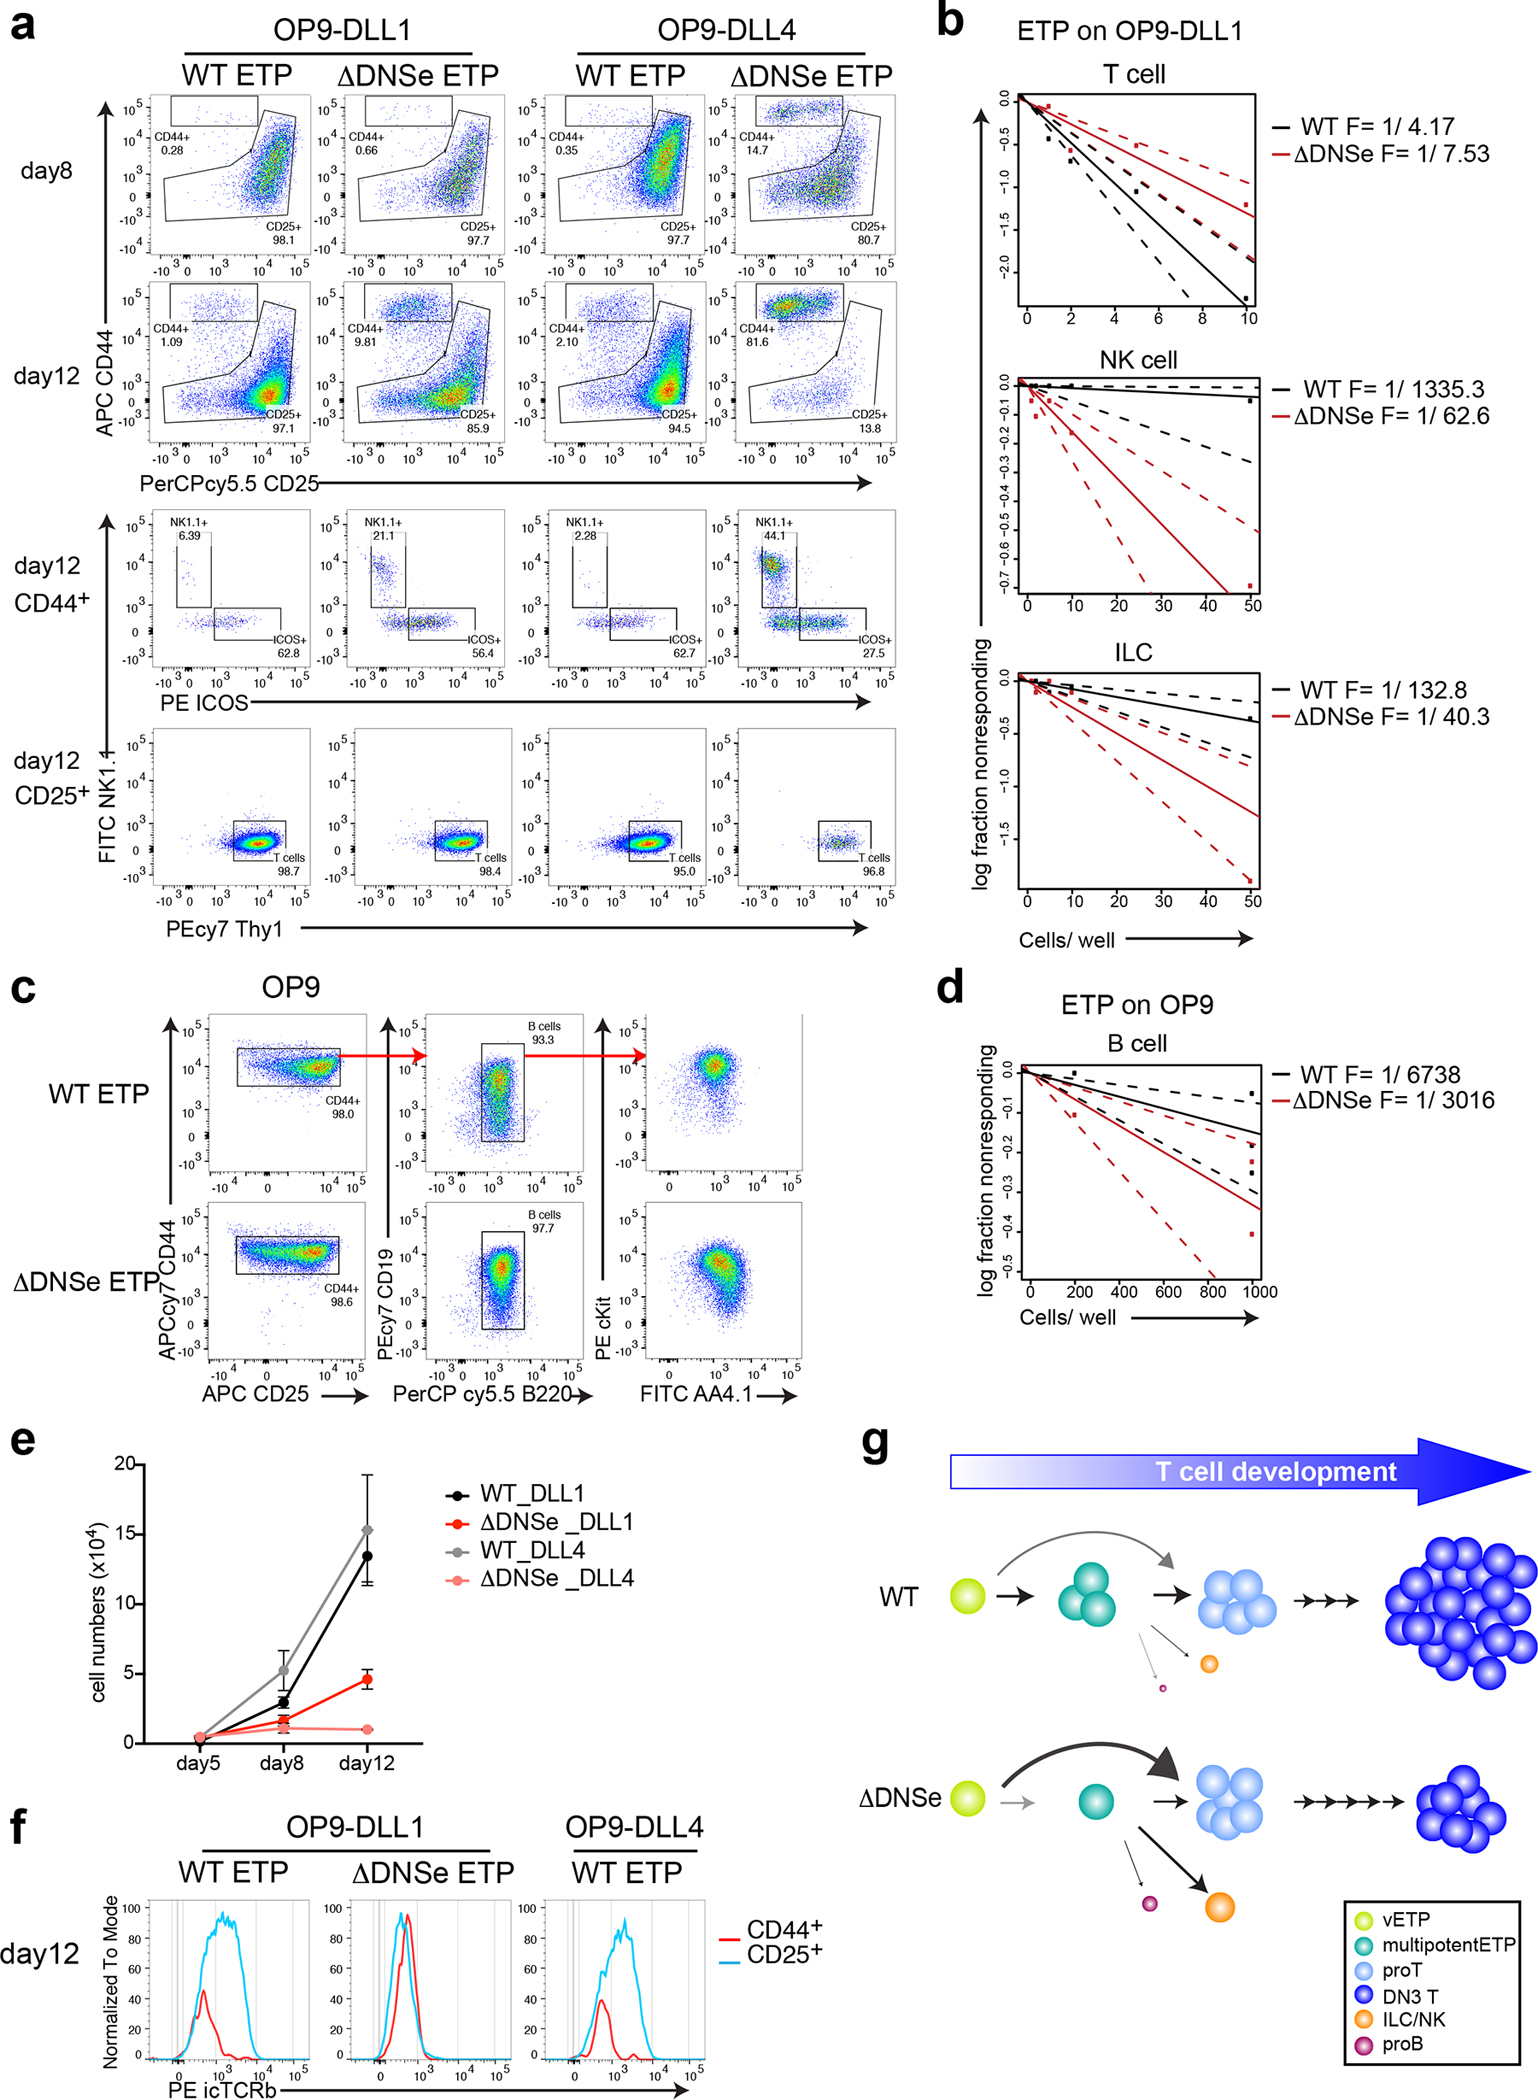
Fig. 5. Increase in innate lymphoid potential and developmental arrest of ΔDNSe DN3.

(a, b, e, f) Lineage potential of ETPs after co-culture on OP9-DLL1 or OP9-DLL4 stroma under T cell differentiation conditions (2ng/ml of IL7 and 5ng/ml of Flt3L). (a) FACS profiles of ETPs are shown after 8–12 days in culture. Cells were tested for expression of T (Thy1+CD44−CD25lo/+), NK (Thy+/− NK1.1+CD44+CD25−/lo), or ILC (Thy1+ICOS+CD44+CD25−/lo) cell lineage differentiation markers. (b) T, NK, and ILC cell lineage differentiation frequencies of WT and ΔDNSe ETPs are shown. (c) FACS profiles of ETPs after 13 days in culture on OP9 stroma for WT or 8 days for ΔDNSe are shown. Expanded cells expressed markers of early B cell differentiation (B220+CD19+AA4.1+cKit+). (d) B cell lineage frequency of WT and ΔDNSe ETPs is shown. Dashed lines in (b) and (d) indicate the 95% confidence interval for the regression line. (e) Absolute number of hematopoietic cells at different time points of culture under T cell differentiation condition are shown (mean +/− SEM). (f) Recombination at the Trb locus was evaluated by expression of intracellular TCRβ (icTCRβ) after 12 days in culture. (g) A model on ETP differentiation by Notch1 signaling. High levels of Notch1 signaling (WT) supported by the DNS enhancer promote the transition of very early ETPs (Flt3+) through a multipotent to a pro-T cell state prior to lineage restriction. Deletion of the DNS enhancer and reduction in Notch1 signaling (ΔDNSe) reduces the number of multipotentETPs and increases precocious ETP differentiation into T and ILC/NK cell lineages.
Data shown in (a, f) are representative FACS profiles from 3 independent experiments with more than 3 technical replicates per genotype per experiment, in (b) are combined data from 2 independent experiments. Data shown in (c) are representative FACS profiles from 3 independent experiments, in (d) are combined data from 3 experiments. Data shown in (e) are representative of 3 independent experiments. Technical replicates (3 wells/each genotype) were analyzed at each time point.
