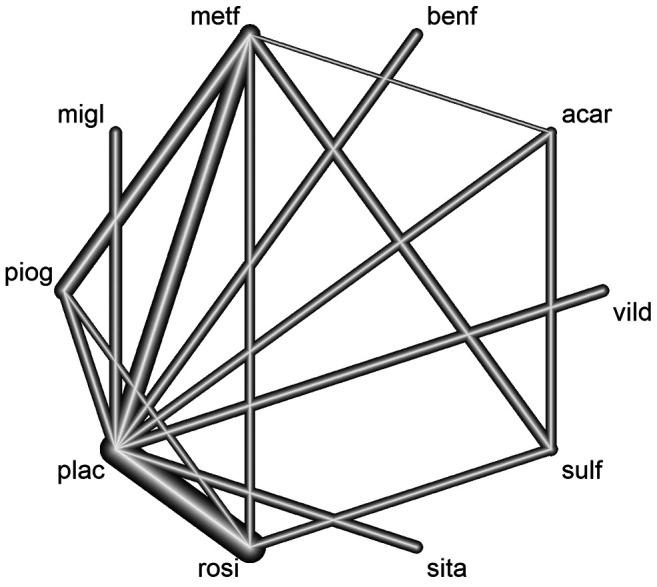
Figure 3. The treatment network for meta-analysis of multiple interventions for investigating efficacy in Diabetes. Nodes represent the treatments in the network and lines represent relative direct comparisons between the treatments. Nodes are weighted by the number of patients receiving each treatment relative to the number of participants in all studies, while the thickness of the line grows proportionally to the number of studies referred to in each comparison.

