
FIGURE 4.
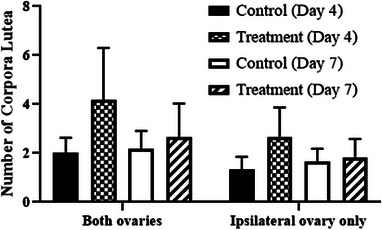
Mean (± SD) of total number of corpora lutea on both ovaries and number ipsilateral to the uterine horn where endometrial tissue was analysed for estrogen receptor expression.
Official websites use .gov
A
.gov website belongs to an official
government organization in the United States.
Secure .gov websites use HTTPS
A lock (
) or https:// means you've safely
connected to the .gov website. Share sensitive
information only on official, secure websites.
Mean (± SD) of total number of corpora lutea on both ovaries and number ipsilateral to the uterine horn where endometrial tissue was analysed for estrogen receptor expression.