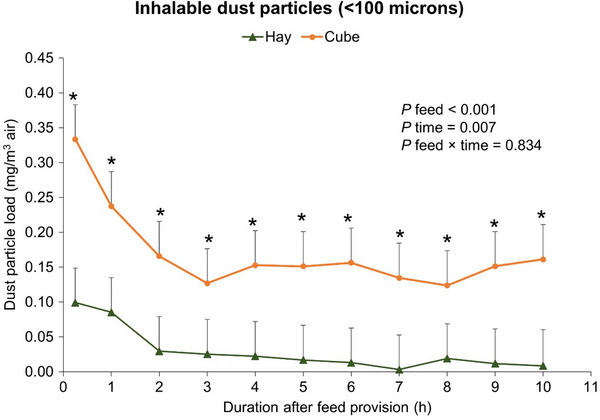
FIGURE 2.

Air concentrations of inhalable dust particles in the feeding area when the horse was offered hay or alfalfa–meadow grass cube. The duration of 0 h corresponds to time of feed provision. Data were measured every 5 s for four consecutive nights per test feed. The mean of entries of the hour (e.g. 20:00:01–20:59:56) were adjusted with the corresponding fifth percentile value to account for the pre‐existing dust concentration in the barn. Error bars represent standard errors of the mean. Asterisk indicates the differences of values between both test feeds at a given duration (p < 0.05). The dust concentrations of the first hour significantly differ from the concentrations detected in later hours (p < 0.05).
